The Kubernetes Metrics Server is a resource metrics monitoring tool for Kubernetes. The Kubernetes Metrics Server measures CPU and memory usage across the Kubernetes cluster. This metrics-server collects metrics and then shows resource usage statistics for your cluster so that you can monitor resource usage for each node and also for each pod.
You can monitor your resource usage with simple commands using the top command like kubectl top pods and kubectl top nodes.
Prerequisites
- A Kubernetes cluster (v1.21 or high) up and running.
- kubectl command line tool installed and configured to interact to your Kubernetes cluster.
- The ability to create and modify Kubernetes objects.
Download and Modify Metrics Server Manifests
1. The first step is to download the latest Metrics Server manifest file from the Kubernetes GitHub repository. Use below wget command to download yaml file.
wget https://github.com/kubernetes-sigs/metrics-server/releases/latest/download/high-availability-1.21+.yaml2. Modify the Metrics Server yaml file to set some configuration options
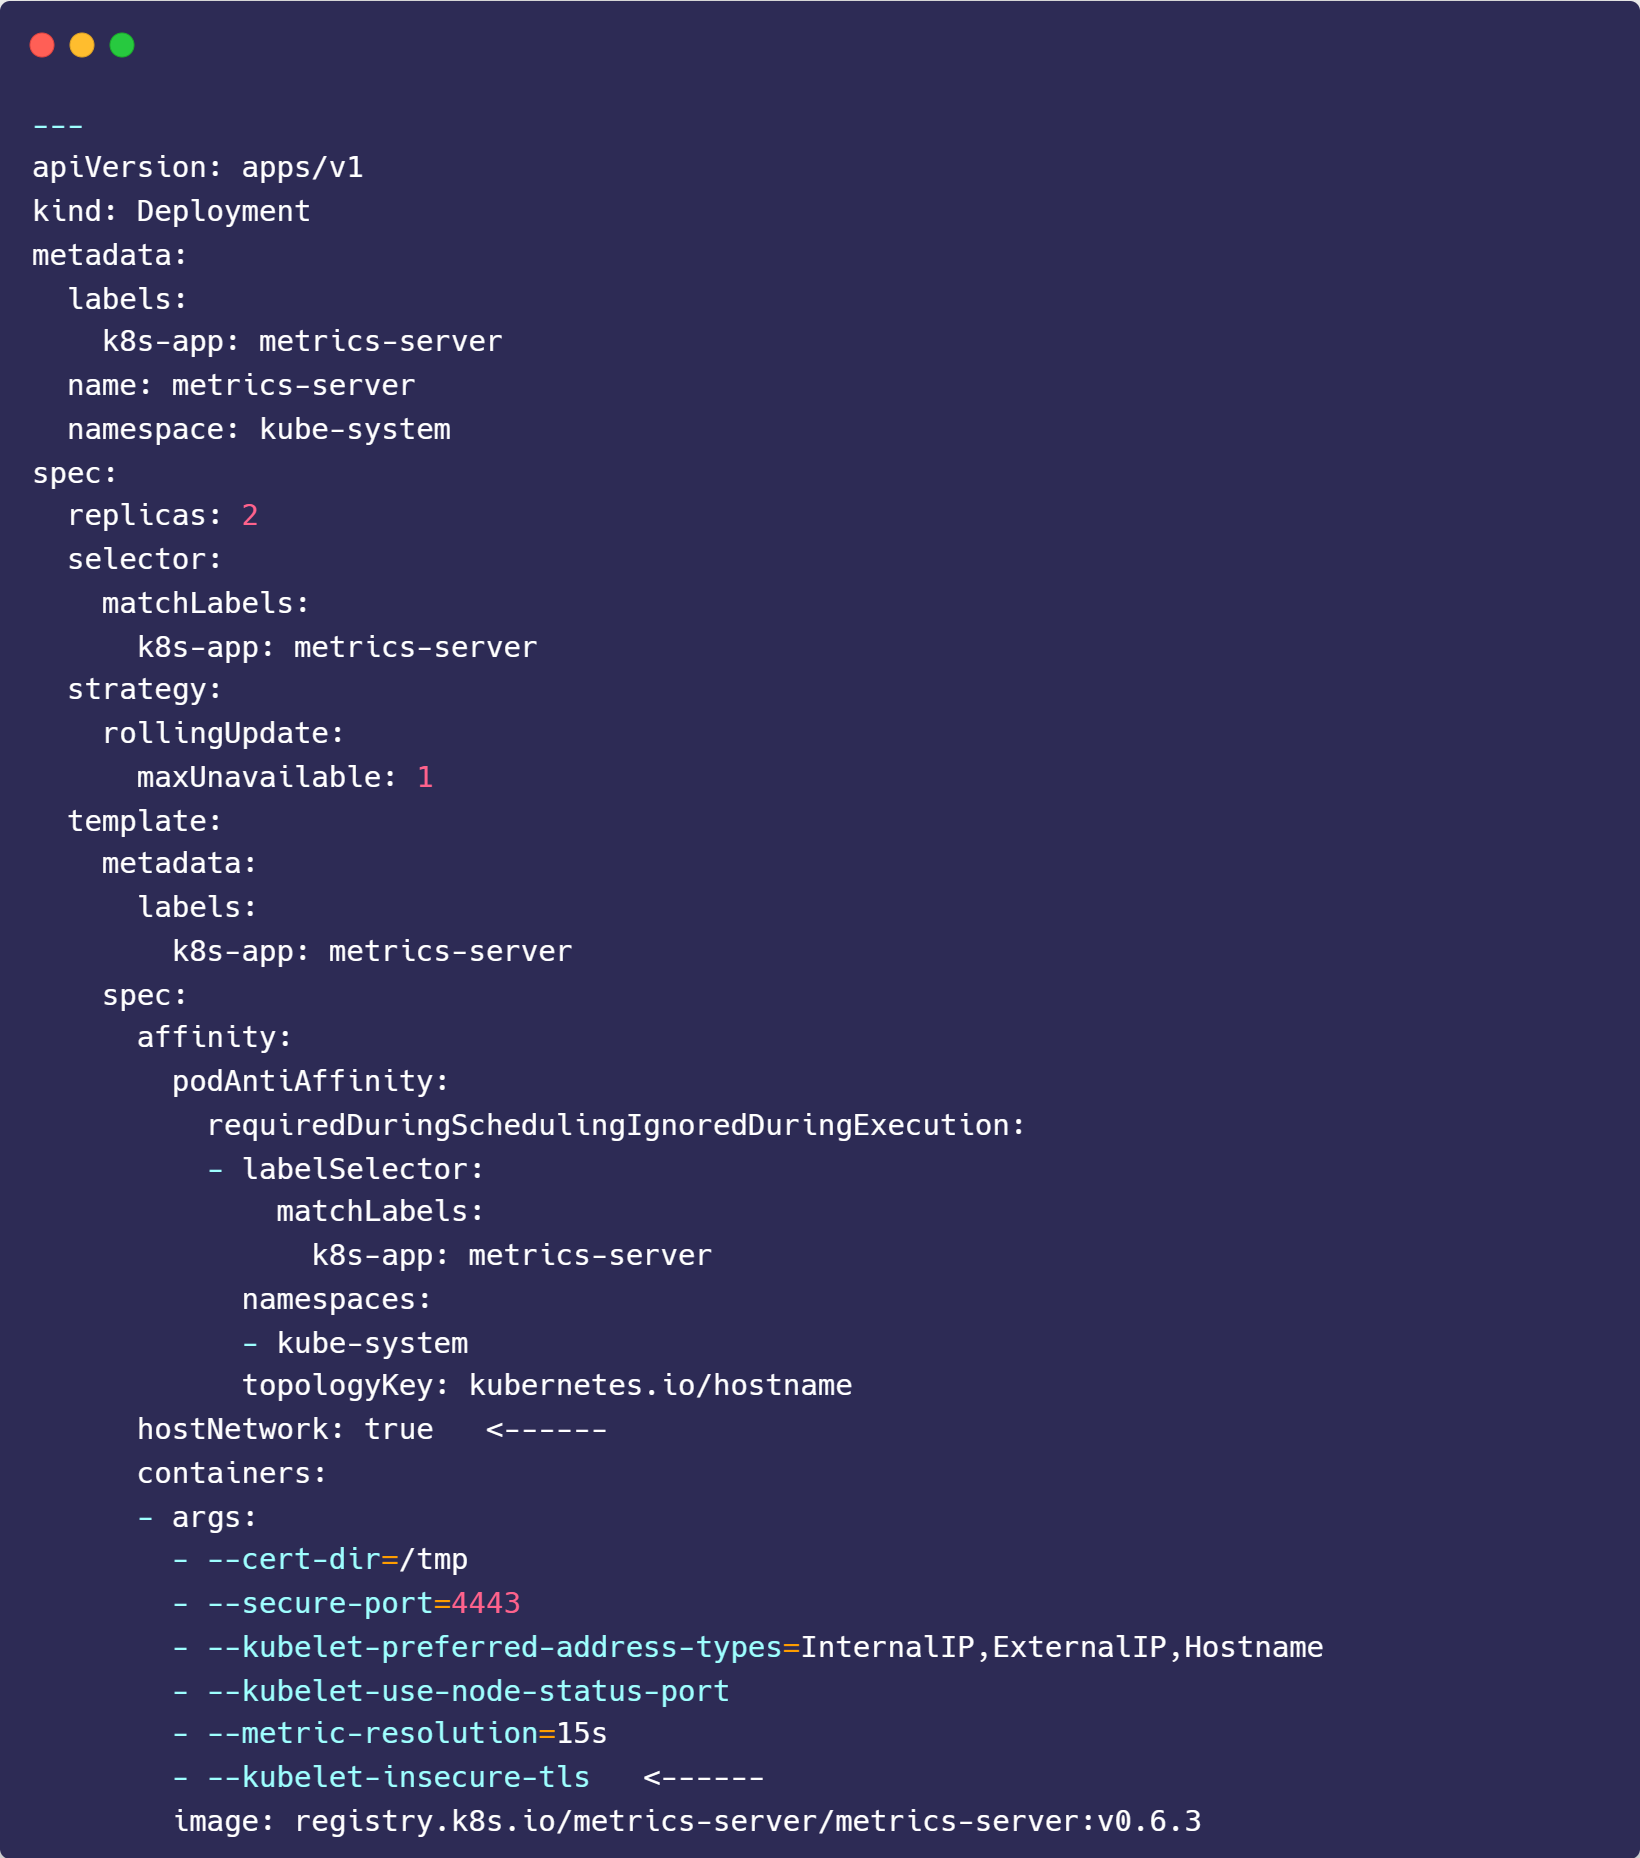
vim high-availability-1.21+.yaml- Find the args section under the container section, add the following line:
--kubelet-insecure-tls- Under the spec section, add following parameter:
hostNetwork: true
Deploy Metrics Server
Now, we are all set to deploy metrics server, run following kubectl command
kubectl apply -f high-availability-1.21+.yaml
kubectl get pods -n kube-system
Test Metrics Server Installation
Test the metrics server by running following kubectl command
kubectl top nodesThis command should display the resource utilization for each node in your cluster, including CPU and memory usage.

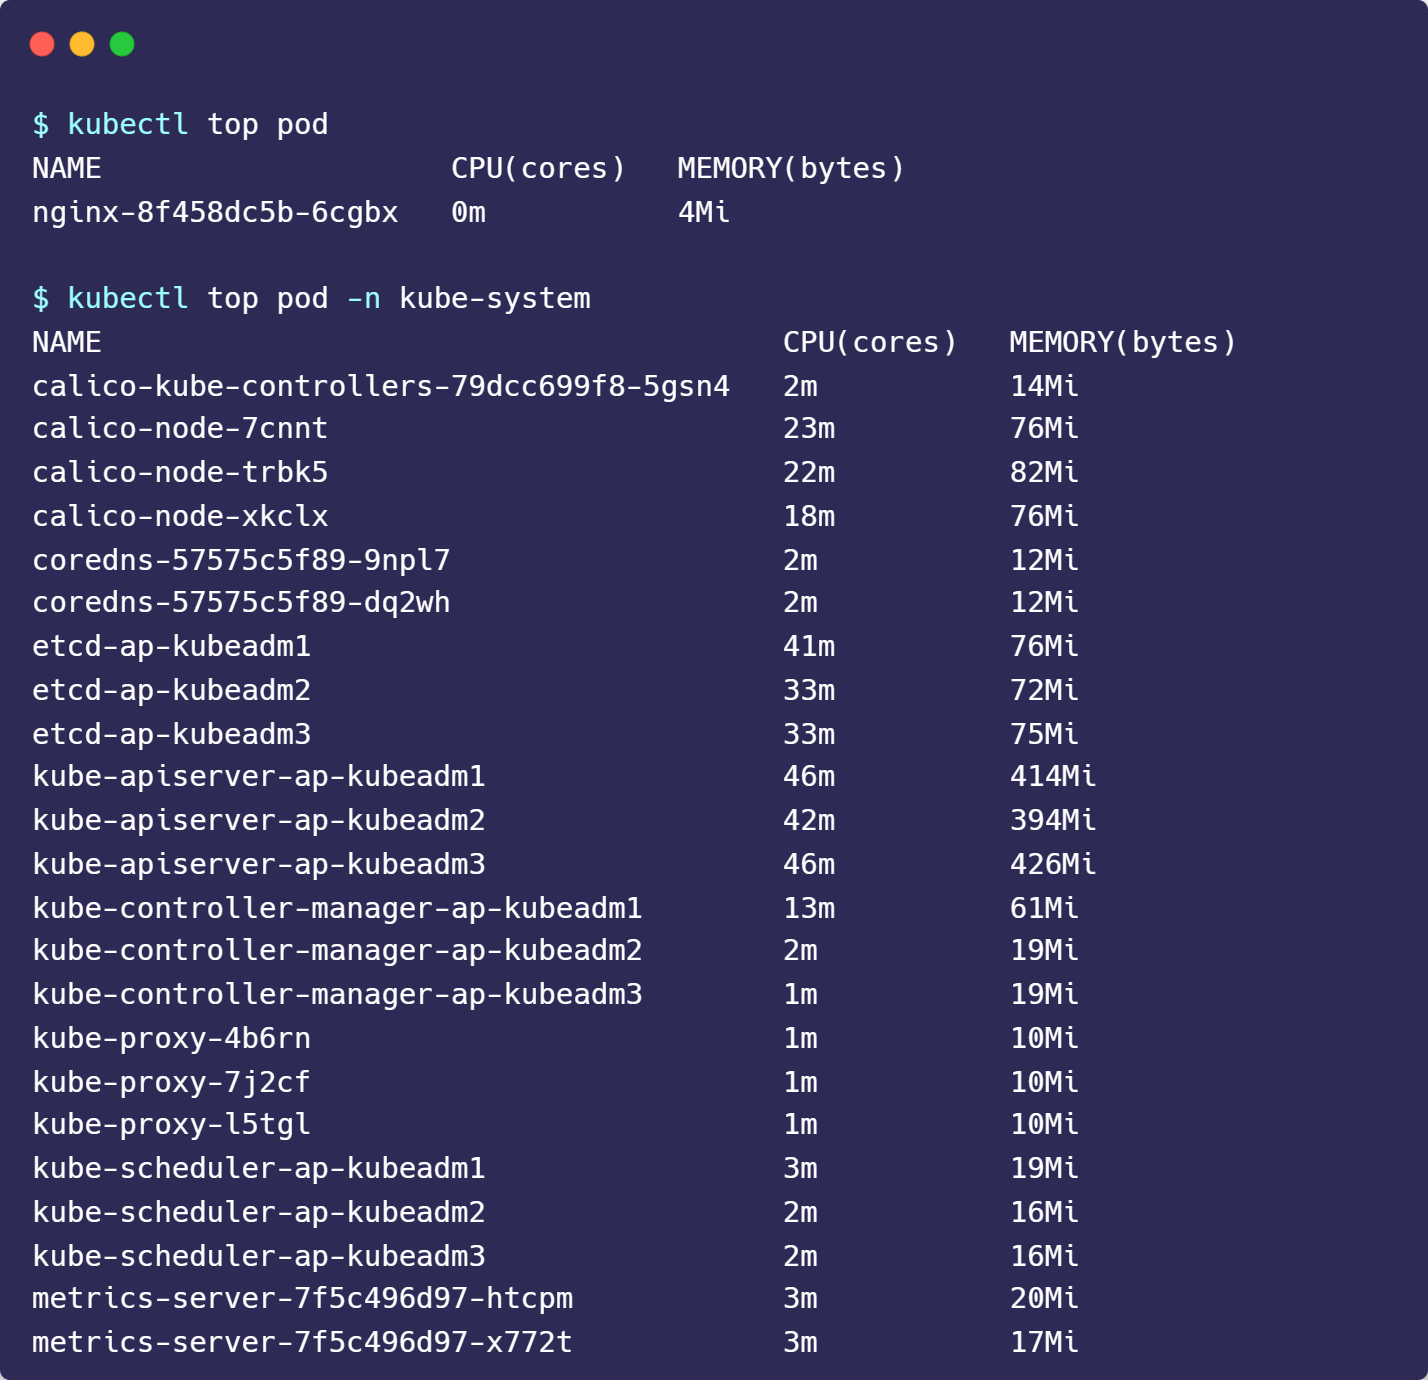
To view pods resource utilization of your current namespace or specific namespace
kubectl top pod
kubectl top pod -n kube-system


