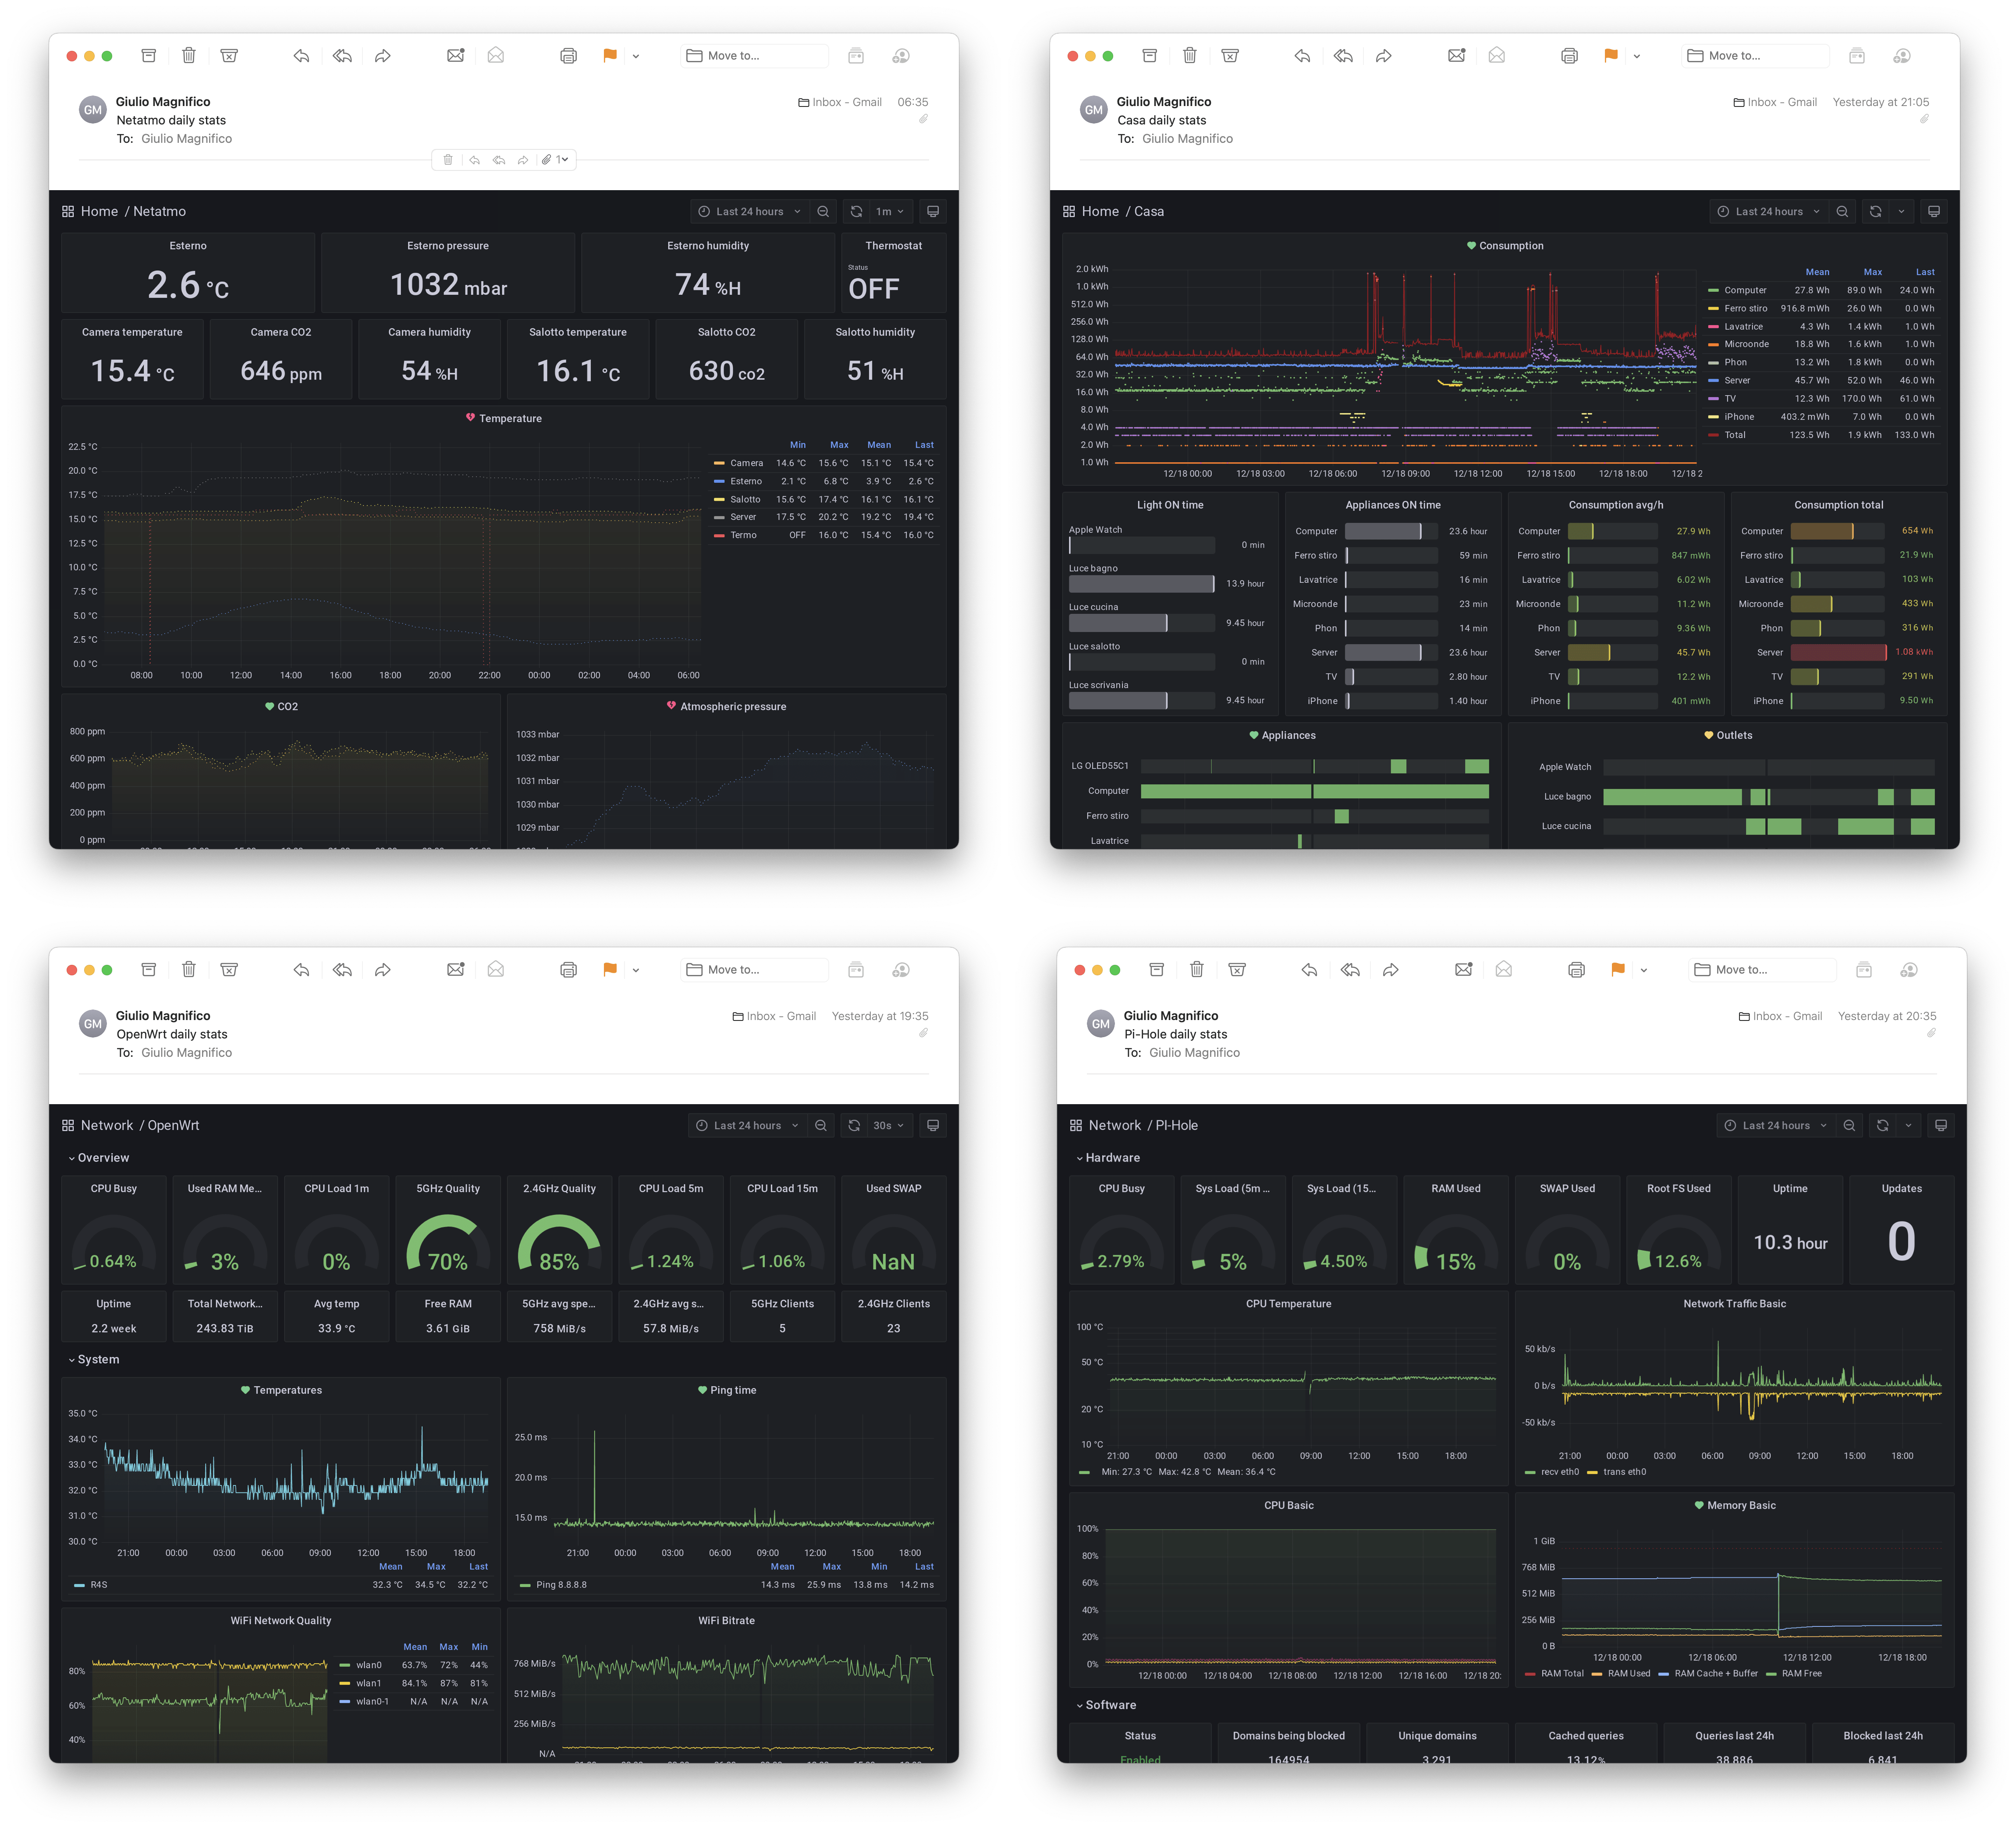
I created this article with the aim of receiving statistics from my Grafana dashboard automatically to my email inbox whenever I want (usually daily and weekly).
Why? Because the statistics generated by Grafana are visually appealing and highly useful when viewed regularly, allowing me to understand my habits and the current state of my environment.
However, I wanted these statistics to be delivered to my email as images, enabling me to have a periodic glance at them. By simply opening an email, I can easily access the dashboard without the need to log in to Grafana beforehand.
Requirements
- Prometheus & Grafana Installed. You can check out my Grafana article:
 Raja Haikal
- Any Configured Grafana Dashboard
- Grafana Plugin: grafana-image-renderer
- Some Unix stuff:
sSMTPandmailutilsto send the PNGs via mail, pluscronandcurlto automatically extract and send the PNGs
Install Grafana Image Renderer
1. Install all necessary dependencies
apt install chromium-browser

apt install -y libx11-xcb1 libxcomposite1 libxcursor1 libxdamage1 libxi6 libxtst6 libnss3 libcups2 libxss1 libxrandr2 libasound2 libatk1.0-0 libatk-bridge2.0-0 libpangocairo-1.0-0 libgtk-3-0

apt install -y libx11-6 libx11-xcb1 libxcomposite1 libxcursor1 libxdamage1 libxext6 libxfixes3 libxi6 libxrender1 libxtst6 libglib2.0-0 libnss3 libcups2  libdbus-1-3 libxss1 libxrandr2 libgtk-3-0 libasound2 libxcb-dri3-0 libgbm1 libxshmfence1
2. Install grafana-image-renderer plugin
grafana-cli plugins install grafana-image-renderer

systemctl restart grafana-server.service
3. Config Plugin (Optional). If you're using self signed for Grafana, I think u need to configure this
nano /etc/grafana/grafana.ini
---
[plugin.grafana-image-renderer]
rendering_ignore_https_errors = true
---

systemctl restart grafana-server.service
Query to Create PNG Image
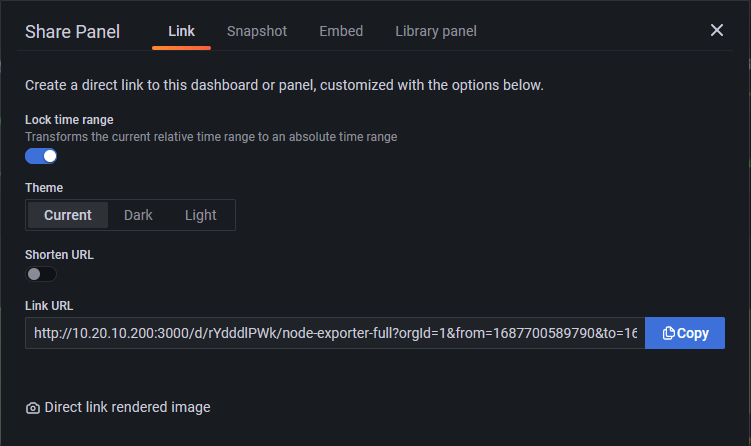
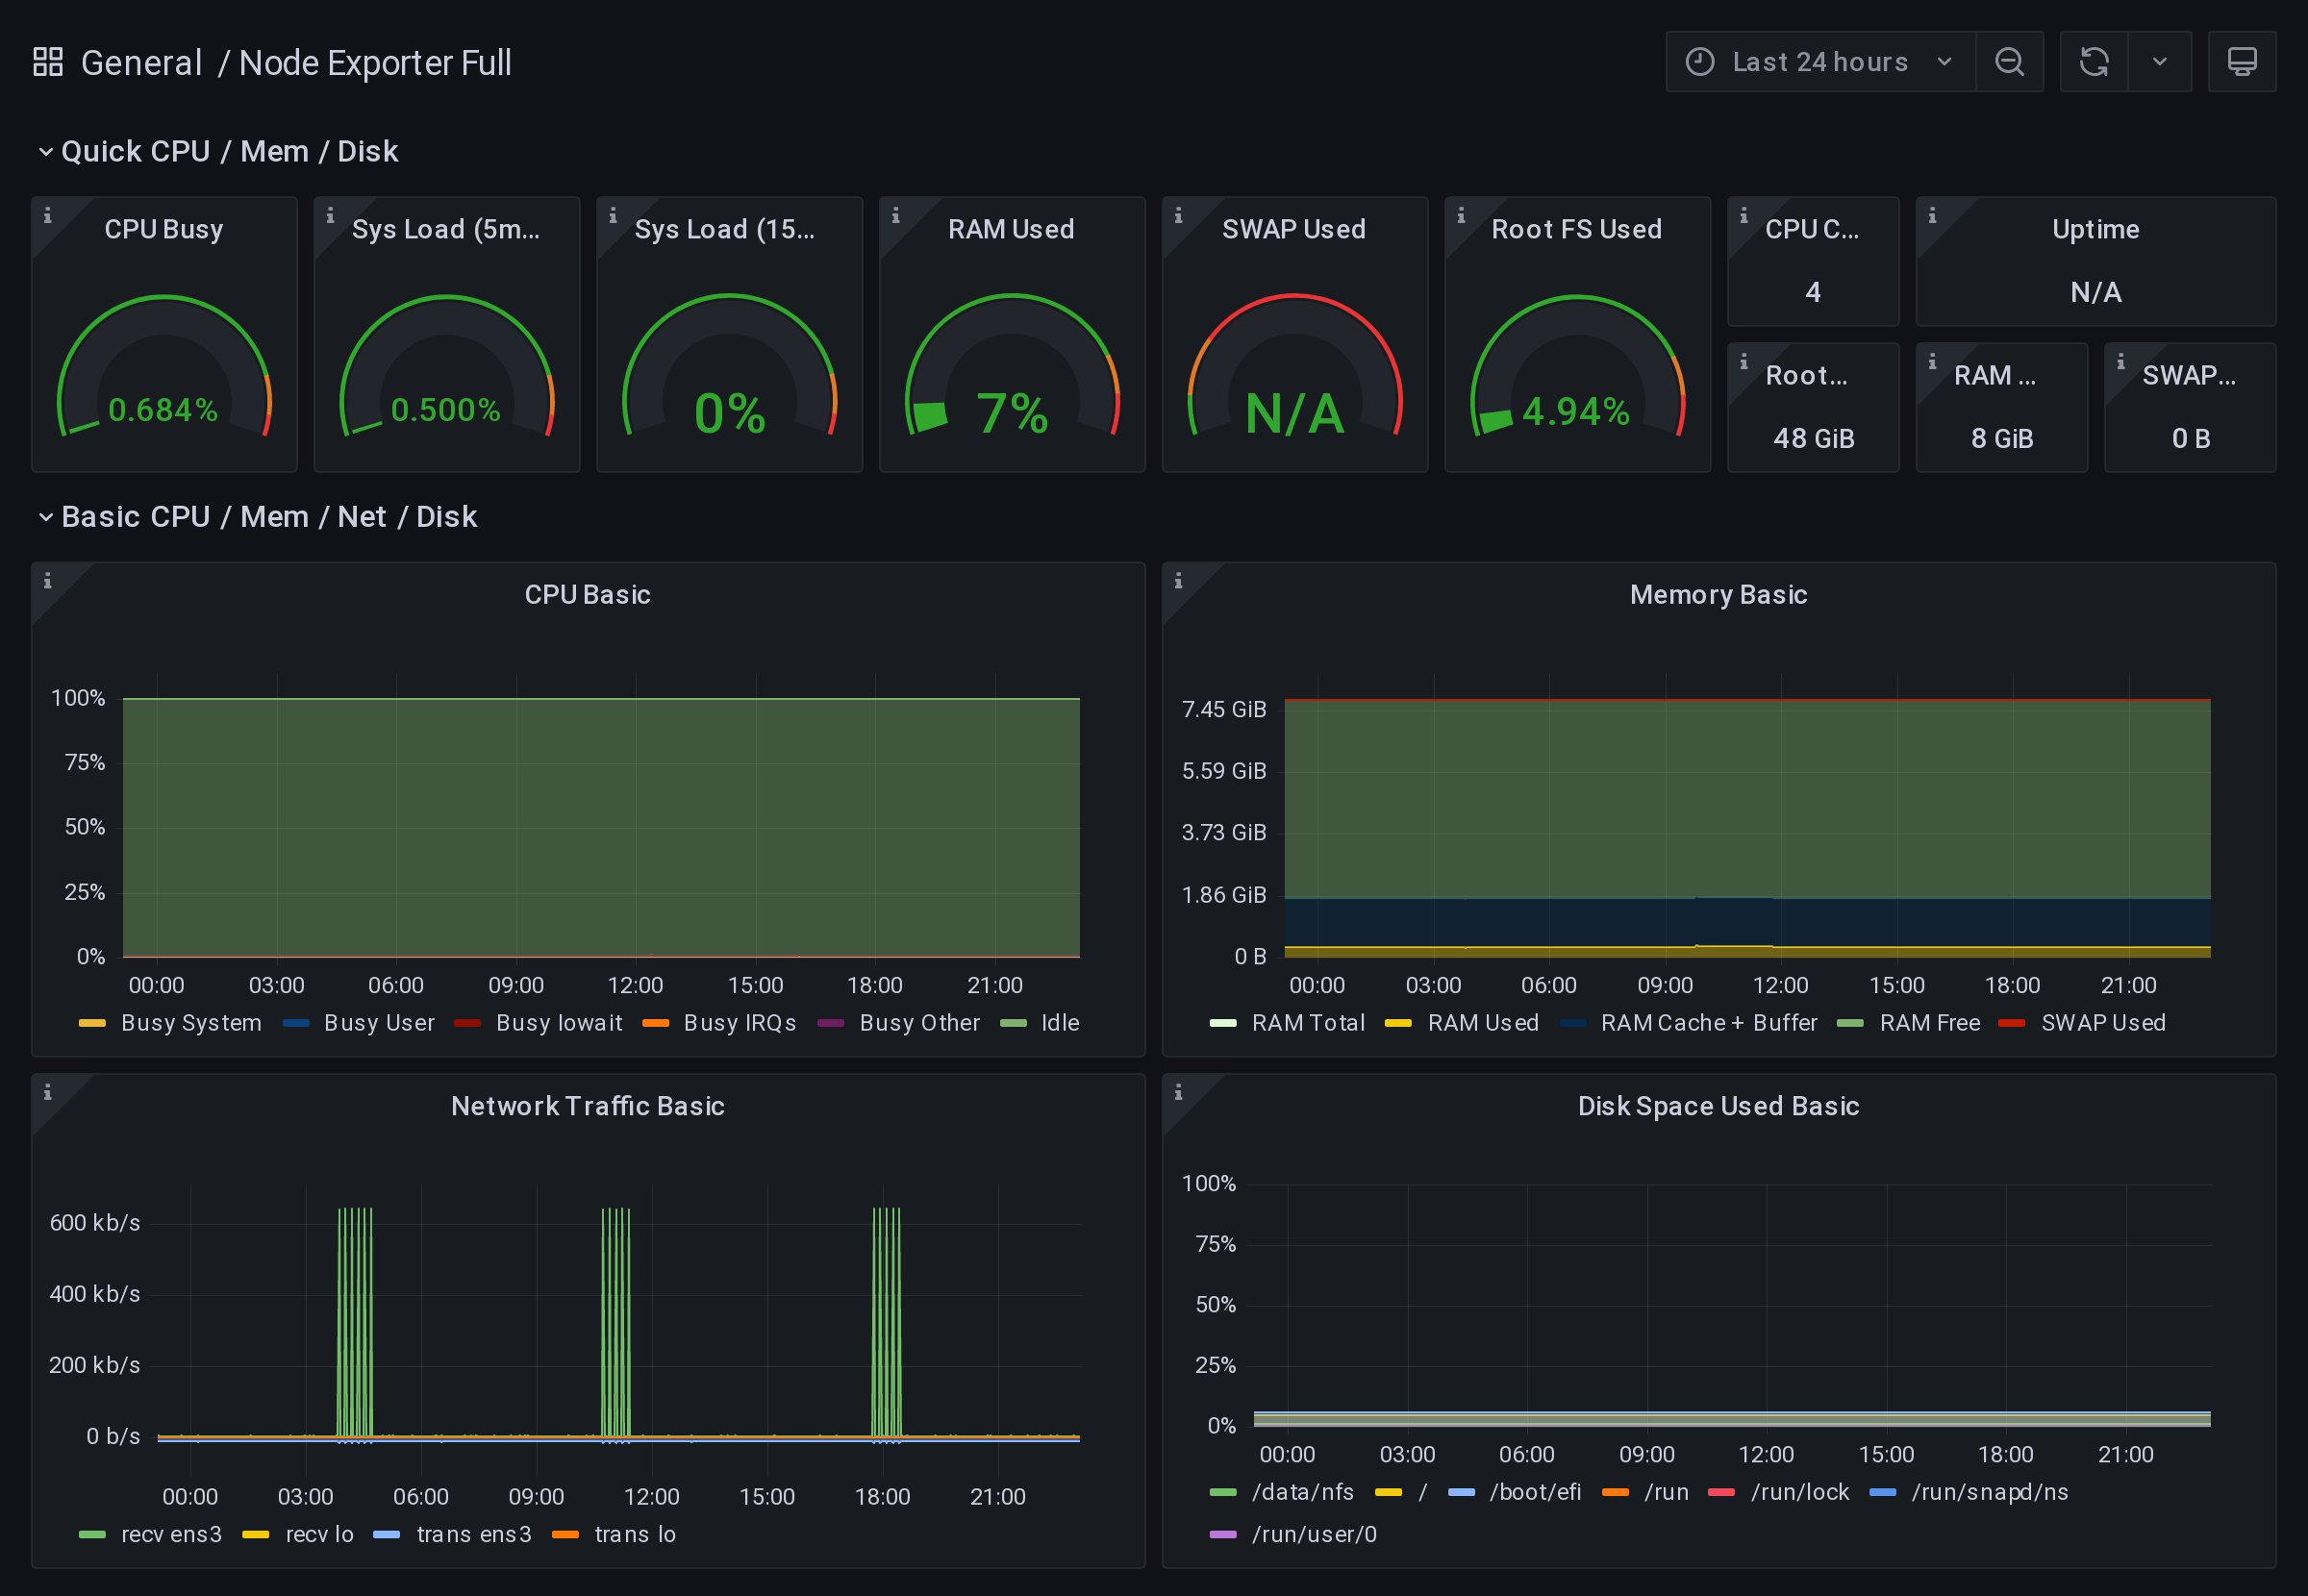
After grafana-image-renderer installed, now you should find the option to share the image of a dashboard panel (tap on a panel > share > Direct link rendered image) here:
If it works for a single panel, you are also able to render the full dashboard using a url with the render query. Your dashboard url should change to:
http://10.20.10.200:3000/render/d-solo/rYdddlPWk/node-exporter-full?orgId=1&from=1687704689788&to=1687791089788&panelId=77&width=1000&height=500&tz=Asia%2FJakarta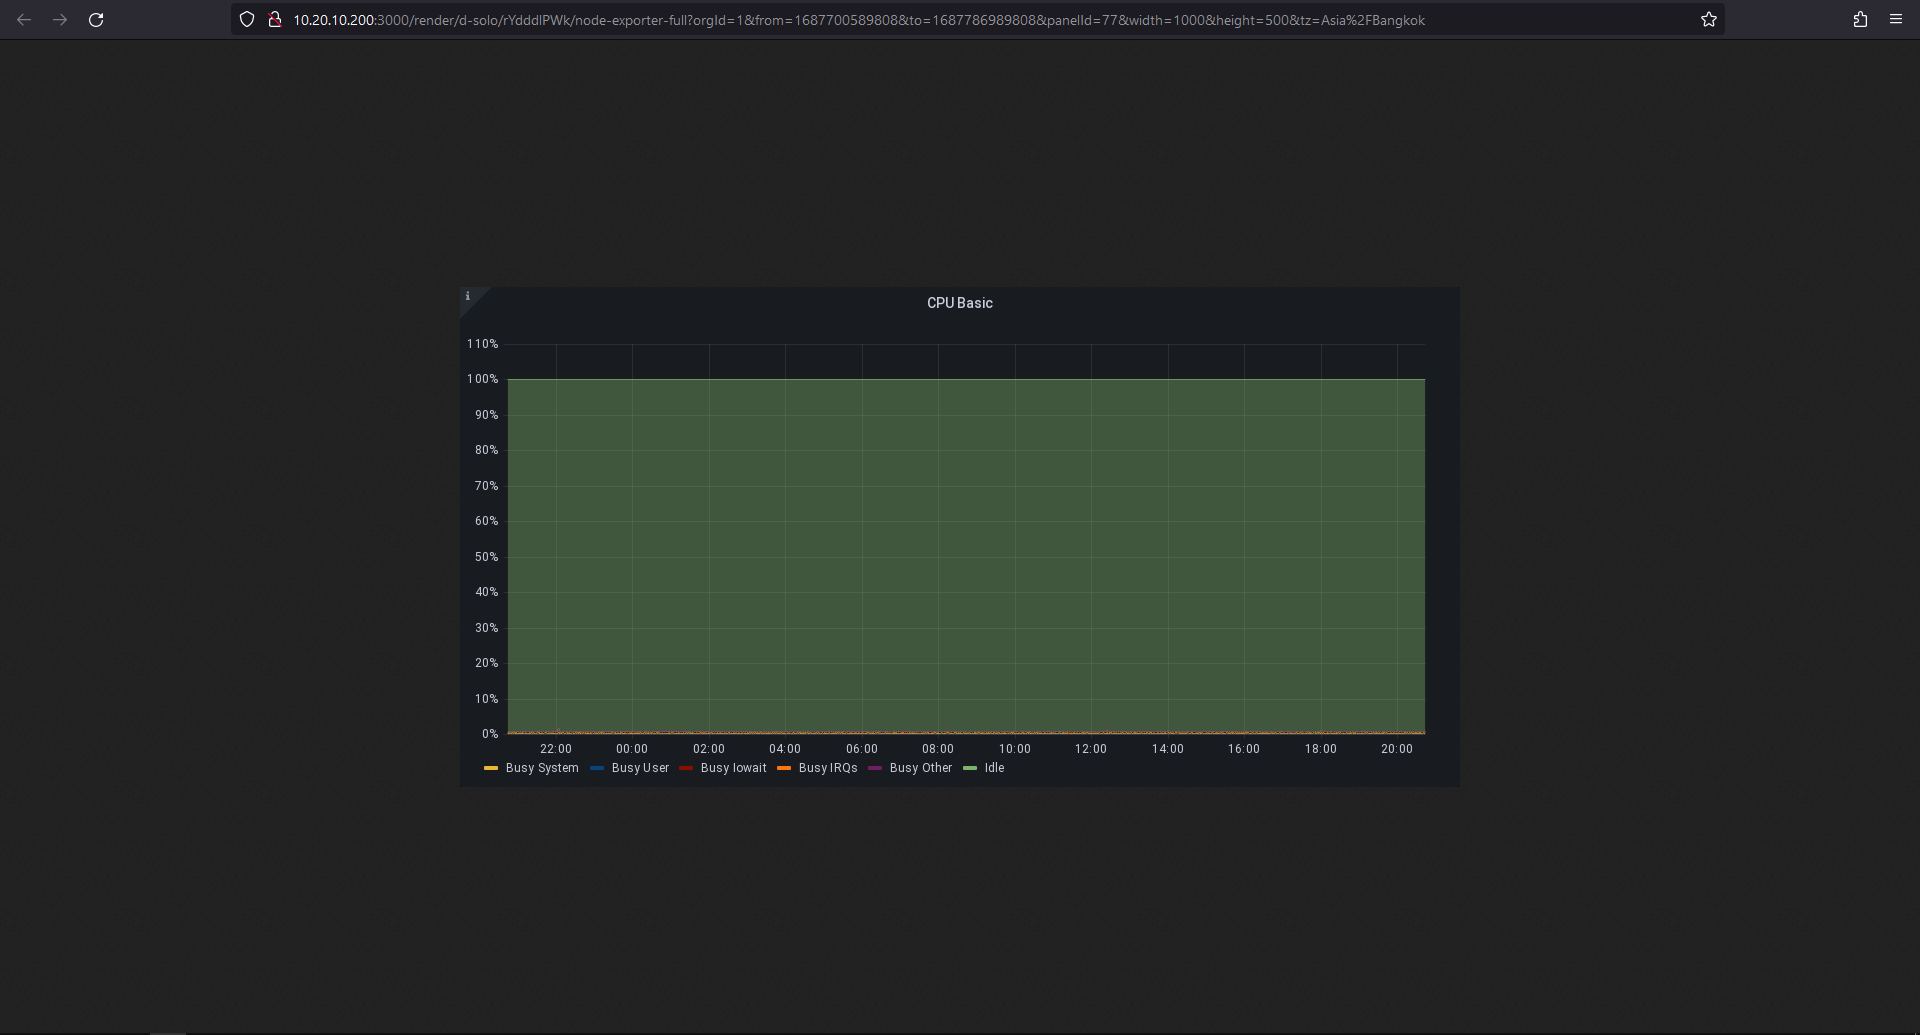
Note: the render after the IP:port
Change query from querying panel image to querying dashboard image like this:
http://10.20.10.200:3000/render/d/rYdddlPWk/node-exporter-full?&from=now-24h&to=now&tz=Asia%2FJakarta&kiosk=tv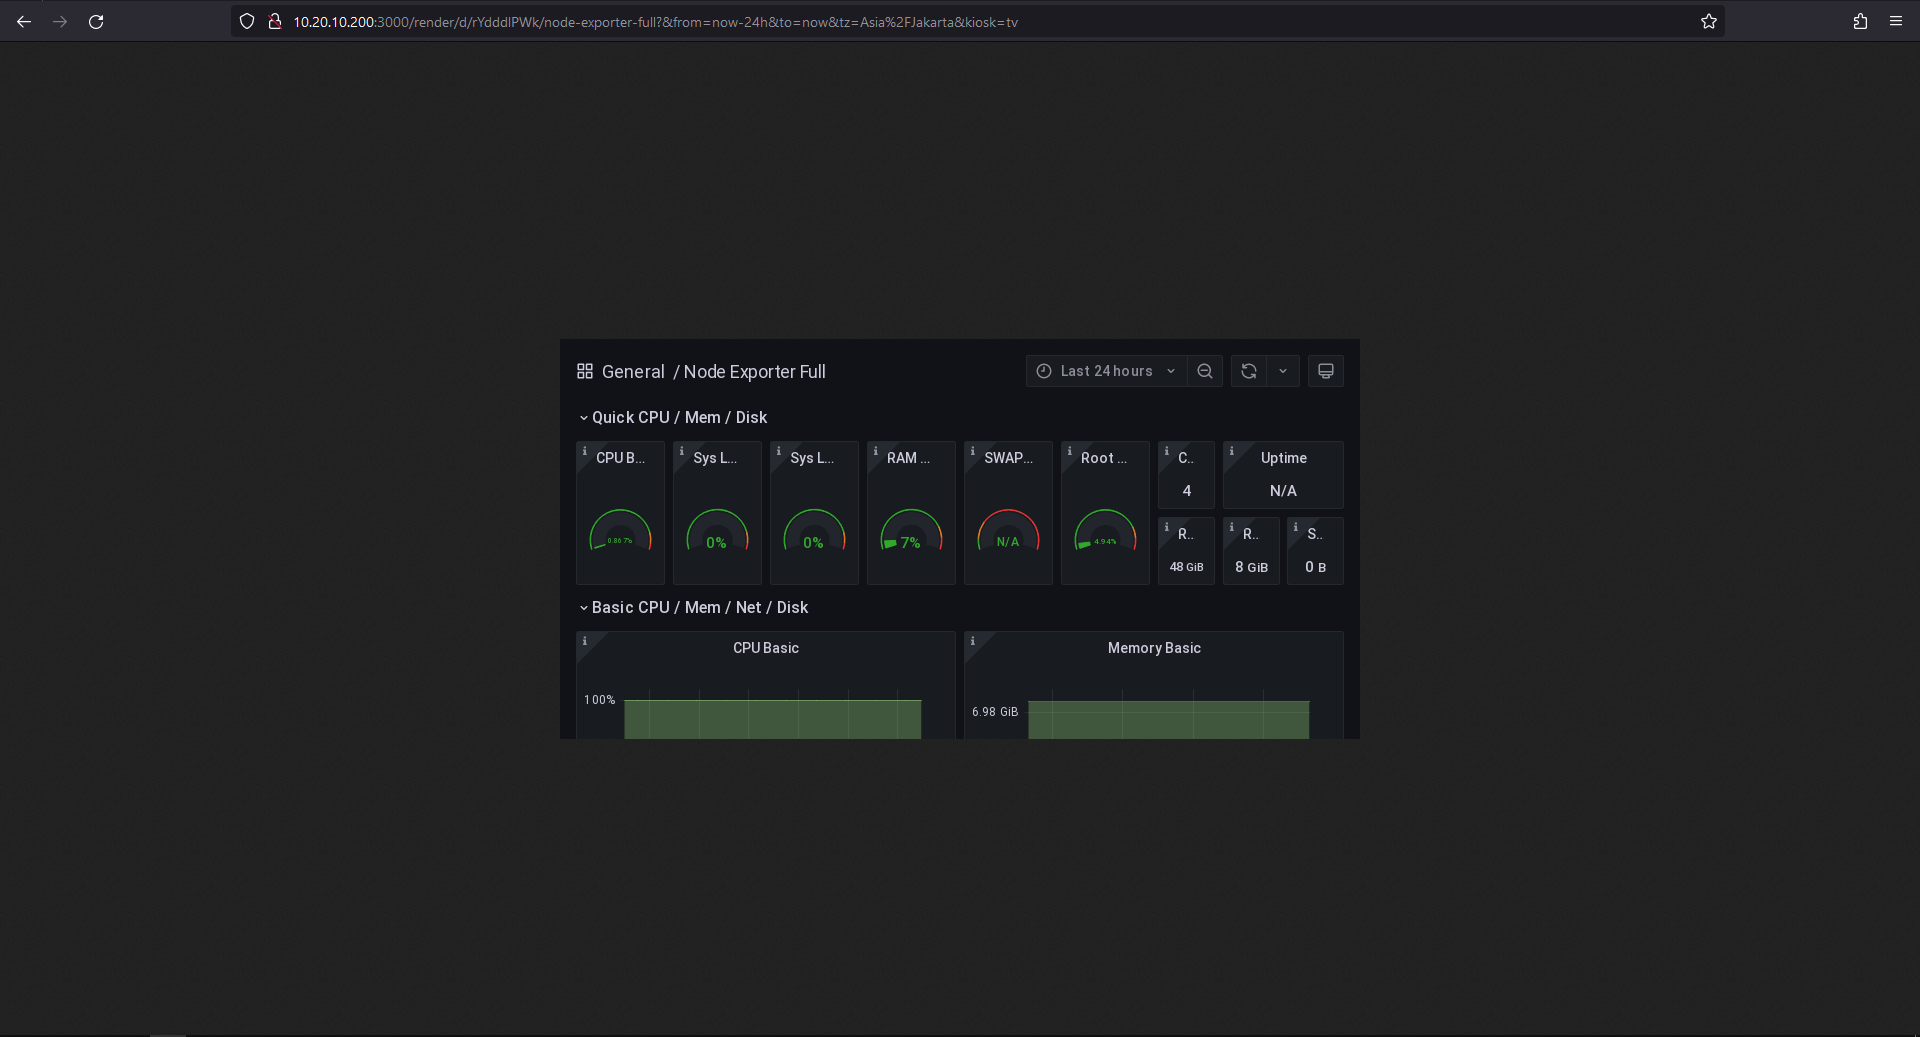
And you have to add the dashboard pixel size parameters (Adjust to your dashboard's width and height). For example:
http://10.20.10.200:3000/render/d/rYdddlPWk/node-exporter-full?&from=now-24h&to=now&tz=Asia%2FJakarta&width=1200&height=830&kiosk=tv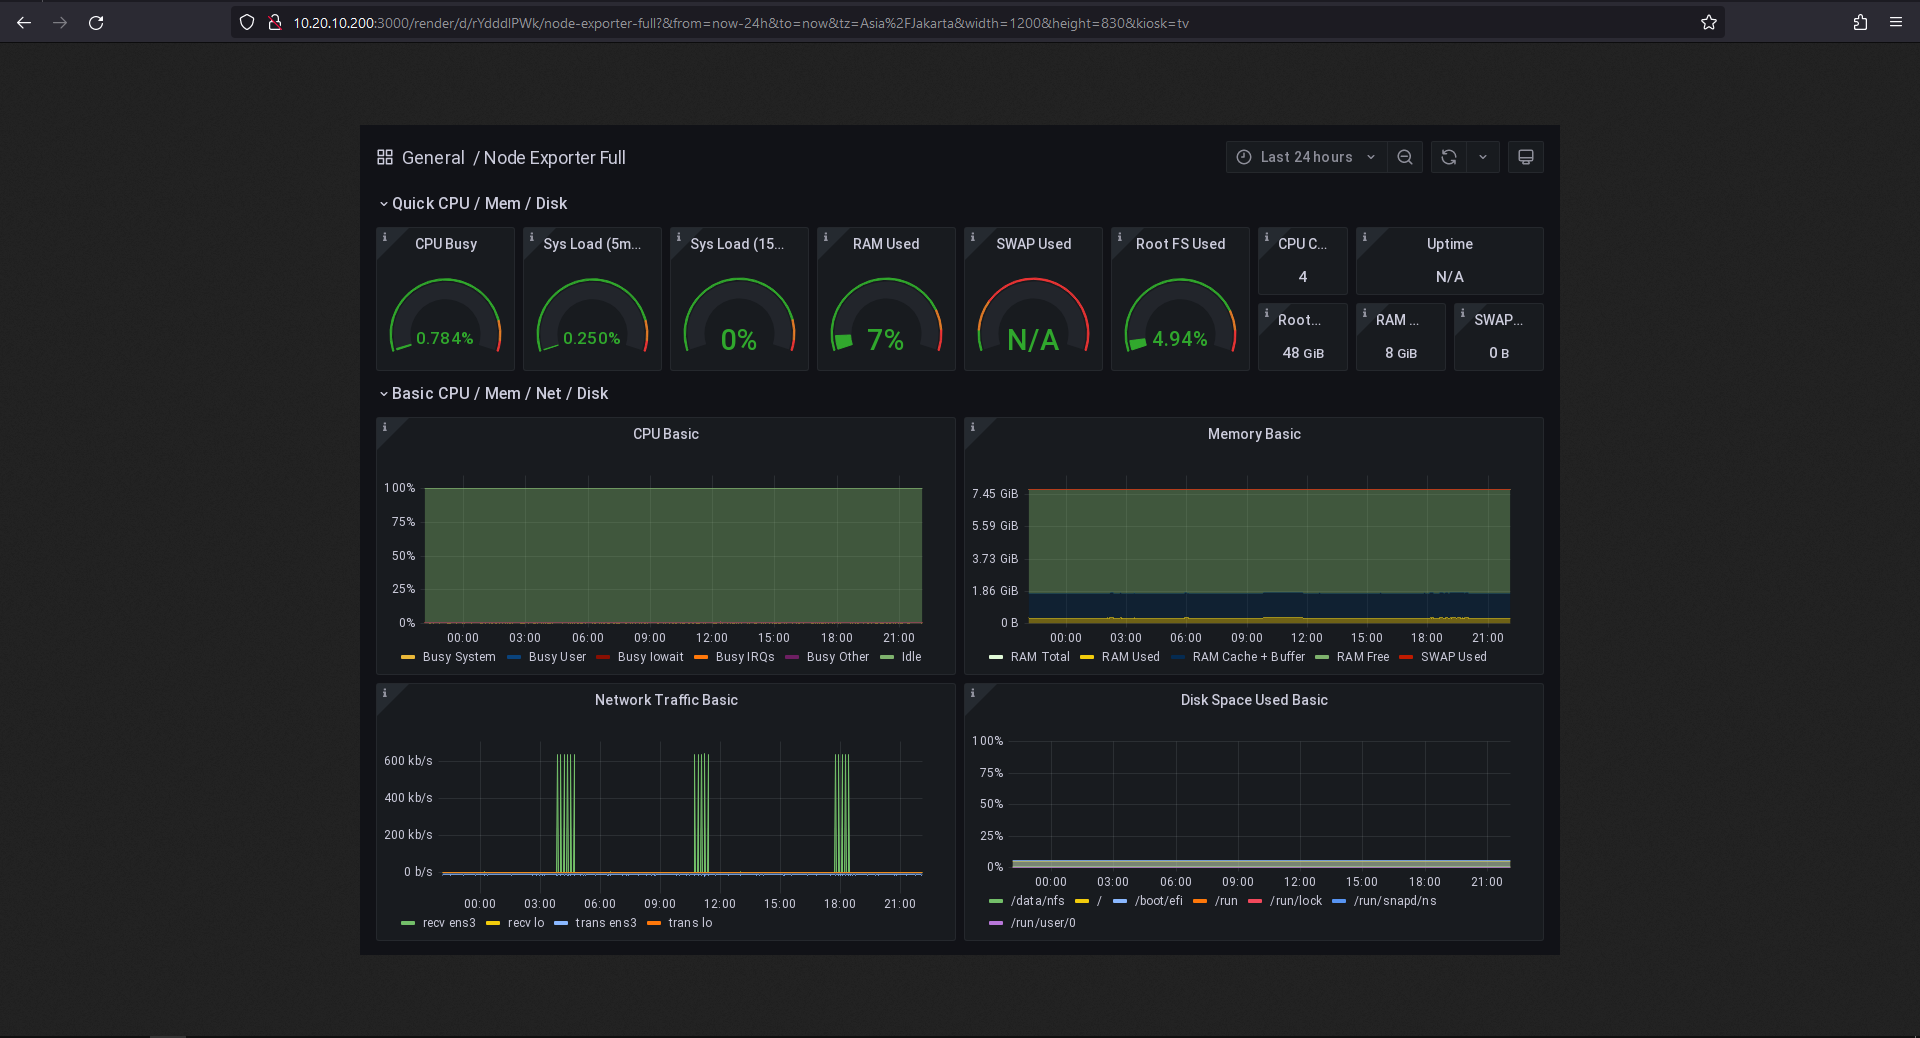
In order to render a retina hi-res png, you need to add the query &scale=2 to the URL (can be used up to 4x).
In the end your complete url query should have these queries:
render / width=1200&height=830 / scale=2
example:
http://10.20.10.200:3000/render/d/rYdddlPWk/node-exporter-full?&from=now-24h&to=now&tz=Asia%2FJakarta&width=1200&height=830&kiosk=tv&scale=2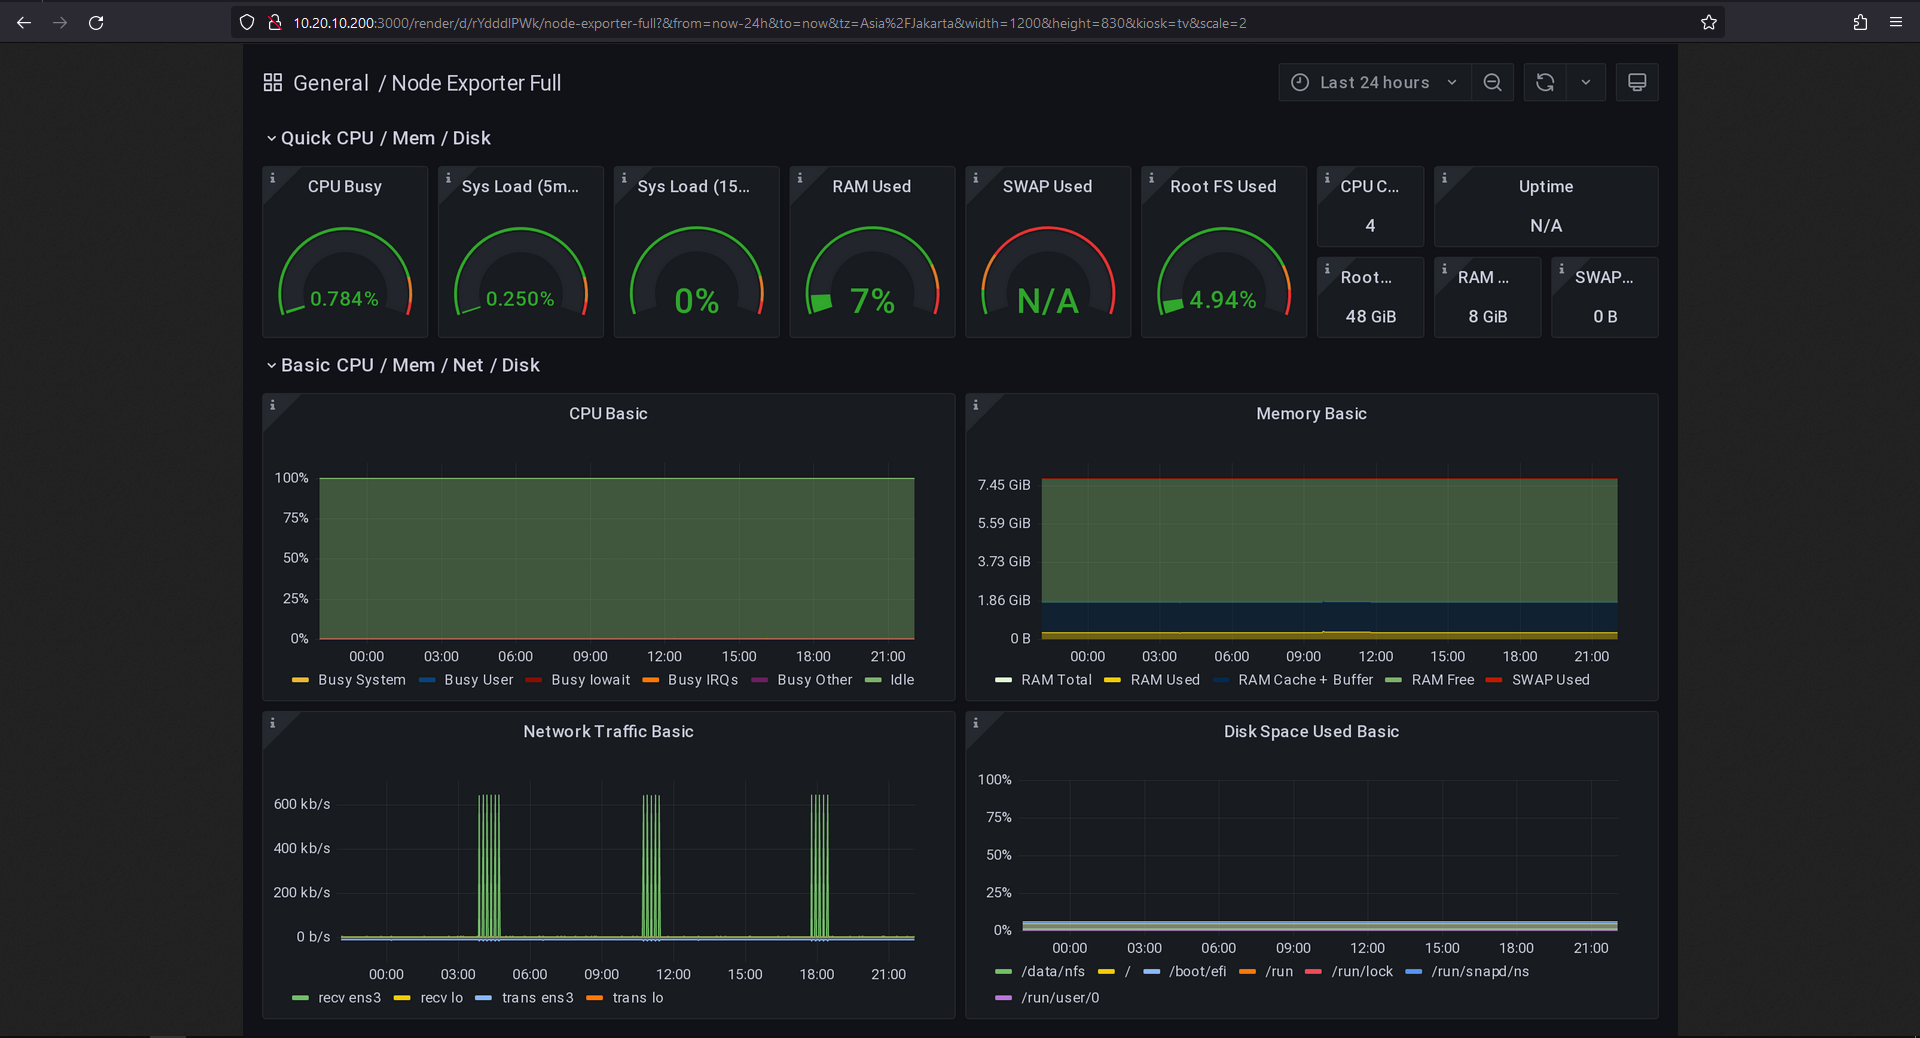
This query will create a png image with a nice resolution.
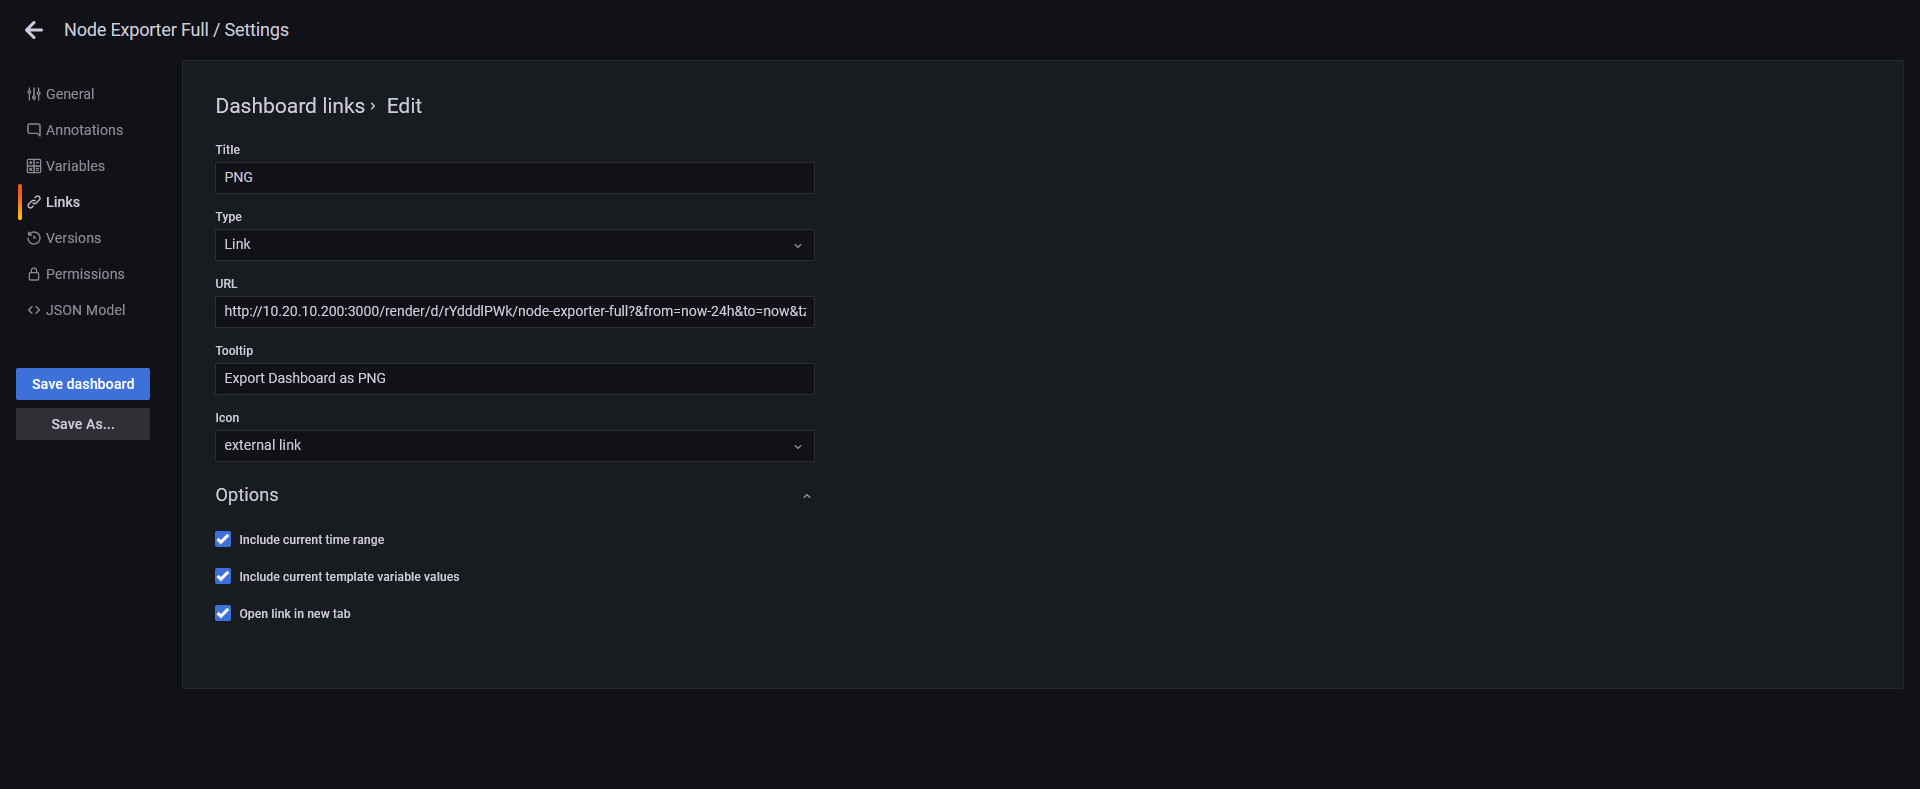
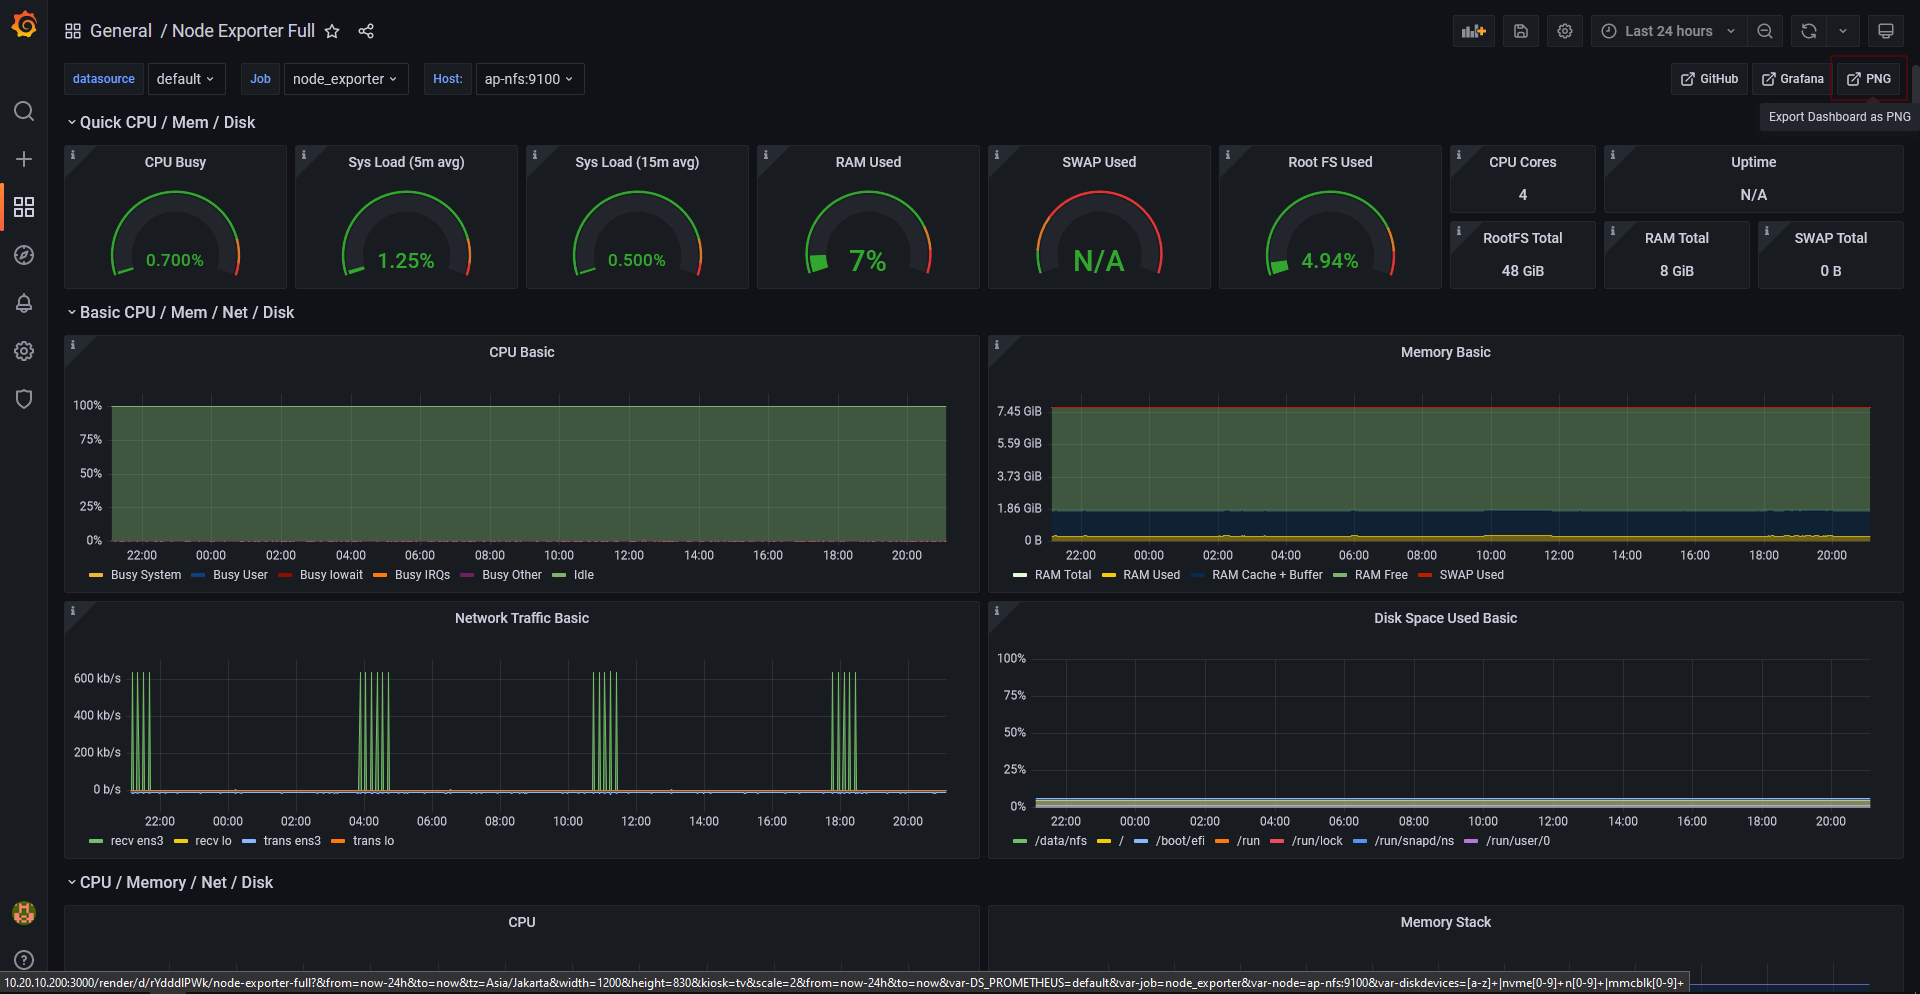
Now you can also add a “Link” to the Grafana dashboard that will create the png with a simple click on it.
Automating the Report
For this step you have to install the tools that will send you the dashboard image via mail. I used mailutils and sSMTP. Install them via apt if you don’t have already installed it in your system, and configure it with your mail account/password.
Install mailutils and sSMTP
apt-get install mailutils ssmtp -yEdit /etc/ssmtp/ssmtp.conf
[email protected]
AuthPass=*
mailhub=smtp.gmail.com:587
UseSTARTTLS=YES
But if you have the 2FA enable -as you should- you first need to generate an app specific password. You have to simply go to your Google profile and you will find the “Signing in to Google” section, generate a new password and copy-paste it in the AuthPass field.
Change the 'From' text by editing /etc/passwd to receive mail from 'YOUR NAME HERE' instead of just 'root'.
chfn -f '[email protected]' rootgrep root /etc/passwd
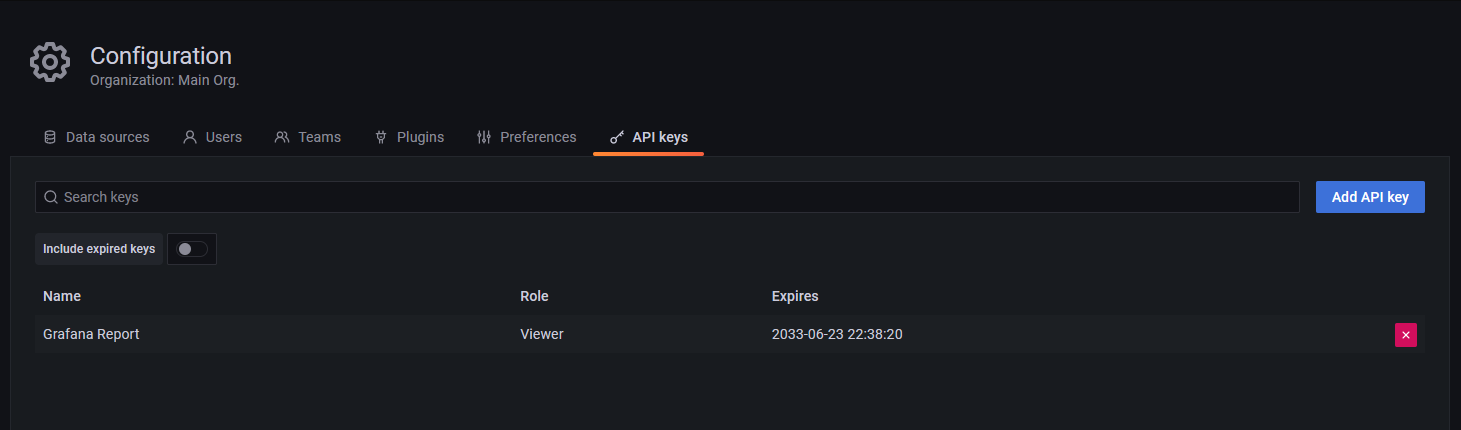
root:x:0:0:[email protected],,,:/root:/bin/bashCreate an API Key in Grafana. We need this to be able to curl the images generated by Grafana Image Renderer and send them via email. Note the API Key given by Grafana.
Now you have to query the Grafana API via grafana-image-render service to build the PNG Image, so I’m using this shell script in crontab to retrieve the png from Grafana.
mkdir -p /root/grafana-report/{image,image-old,logs}
cd /root/grafana-report
nano export-dashboard-node.sh
---
#!/bin/bash
# Export Grafana Dashboard : Node Exporter Full
API_KEY="<api-key>"
URL="http://10.20.10.200:3000/render/d/rYdddlPWk/node-exporter-full?&from=now-24h&to=now&tz=Asia%2FJakarta&width=1200&height=830&kiosk=tv&scale=2"
echo ":::: Execute on $(date) ::::"
BACKUP_DIR=/root/grafana-report/image/
FILE_SUFFIX=_report-summary-nodes
FILE=`date +"%Y%m%d"`${FILE_SUFFIX}.png
OUTPUT_FILE=${BACKUP_DIR}/${FILE}
# Curl Grafana Dashboard
# Use this command to get Grafana Panel Image.
curl -k -H "Authorization: Bearer ${API_KEY}" "${URL}" > ${OUTPUT_FILE}
# Script has Done
echo "${FILE} was downloaded:"chmod +x export-dashboard-node.shThe above script will download the PNG image generated by Grafana Image Renderer with a filename based on the date when the script is executed, appended with '_report-summary-nodes'.
You can also do it for other dashboards with different URL, FILE_SUFFIX and OUTPUT_FILE.Now we need to create a script to send the email.
nano send-email.sh
---
#!/bin/bash

# Delete Files older than 30 Days
echo "Delete Files Older Than 30 Days"
find /root/grafana-report/image-old/* -mtime +30 -exec rm -f {} \;

# Variables
BODY="Hello Team \nHere is the Report of Grafana - Server Resource Overview Stats for today. Thankyou"
EMAIL1=<destination-email>@gmail.com

FILE_SUFFIX=_report-summary-nodes
FILE=`date +"%Y%m%d"`${FILE_SUFFIX}.png

ATTACH=/root/grafana-report/image/$FILE

# Send email
echo ":::: Execute on $(date) ::::"

echo -e $BODY | mail -s "Grafana - Server Resource Overview Stats" $EMAIL1 --attach=$ATTACH

echo "Email was sended:"

# Move Image to Old Image Directory
mv /root/grafana-report/image/* /root/grafana-report/image-old/
chmod +x send-email.shThe above script will delete images that are older than 30 days. It will also send an email to the destination email containing the report and the previously downloaded images.
Let's Test the Script First.
$ ./export-dashboard-node.sh
$ ls image/
20230626_report-summary-nodes.png
$ ./send-email.sh
$ ls image-old/
20230626_report-summary-nodes.png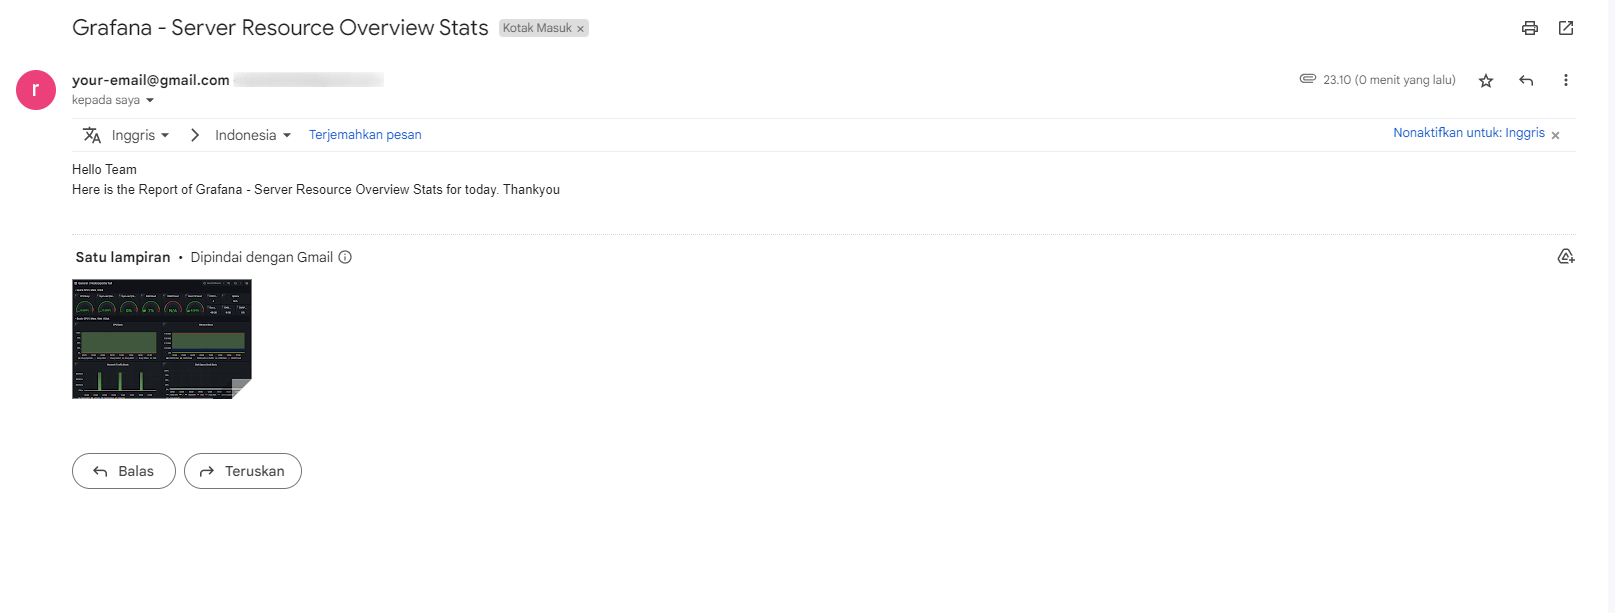
Create Crontab for Daily
crontab -e
---
CRON_TZ=Asia/Jakarta

# Export Image
30 6 * * * /usr/bin/bash /root/grafana-report/export-dashboard-node.sh >> /root/grafana-report/logs/export-dashboard-node.log 2>&1

# Send Email
35 6 * * * /usr/bin/bash /root/grafana-report/send-email.sh >> /root/grafana-report/logs/send-email.log 2>&1
systemctl restart cron.serviceReference