Install Prometheus
Prometheus is a monitoring platform that collects metrics from monitored targets by scraping metrics HTTP endpoints on these targets.
1. Use the curl or wget command to download Prometheus extract all Prometheus files from the archive.
wget https://github.com/prometheus/prometheus/releases/download/v2.37.5/prometheus-2.37.5.linux-amd64.tar.gz

tar -xvf prometheus-2.37.5.linux-amd64.tar.gz
2. Let's create a dedicated Linux user or sometimes called a system account for Prometheus. Having individual users for each service serves two main purposes:
- It is a security measure to reduce the impact in case of an incident with the service.
- It simplifies administration as it becomes easier to track down what resources belong to which service.
sudo useradd --system \
    --no-create-home \
    --shell \
    /bin/false prometheus
3. Create a /data/prometheus directory. Also, you need a folder for Prometheus configuration files.
sudo mkdir -p /data/prometheus /etc/prometheus
4. Copy the example of the main prometheus configuration file.
sudo cp prometheus-2.37.5.linux-amd64/prometheus.yml /etc/prometheus/5. Let's move the prometheus binary and a promtool to the /usr/local/bin/. promtool is used to check configuration files and Prometheus rules.
sudo cp prometheus-2.37.5.linux-amd64/prometheus /usr/local/bin/
sudo cp prometheus-2.37.5.linux-amd64/promtool /usr/local/bin/
6. Move console libraries to the Prometheus configuration directory. Console templates allow for the creation of arbitrary consoles using the Go templating language.
sudo cp -r prometheus-2.37.5.linux-amd64/consoles /etc/prometheus
sudo cp -r prometheus-2.37.5.linux-amd64/console_libraries /etc/prometheus
7. To avoid permission issues, you need to set correct ownership for the /etc/prometheus/ and /data/prometheus directory.
sudo chown -R prometheus:prometheus /etc/prometheus/ /data/prometheus8. Copy prometheus.service to systemd
cat<<EOF | tee -a /etc/systemd/system/prometheus.service
[Unit]
Description=Prometheus
Wants=network-online.target
After=network-online.target

[Service]
User=prometheus
Group=prometheus
Type=simple
ExecStart=/usr/local/bin/prometheus \
  --config.file /etc/prometheus/prometheus.yml \
  --storage.tsdb.path /data/prometheus/ \
  --web.console.templates=/etc/prometheus/consoles \
  --web.console.libraries=/etc/prometheus/console_libraries \
  --storage.tsdb.retention.time=30d \
  --web.listen-address=0.0.0.0:9090 \
  --web.enable-lifecycle

[Install]
WantedBy=multi-user.target
EOF
9. Enable & Start Prometheus
sudo systemctl enable --now prometheus.service
sudo systemctl status prometheus.service
Securing Prometheus with Basic Auth
When you install Prometheus, it will be open to anyone who knows the endpoint. Fairly recently, Prometheus introduced a way to add basic authentication to each HTTP request. Used to be you had to install a proxy such as nginx at the front of Prometheus and configure basic auth there. Now you can use a built-in authentication mechanism to the Prometheus itself.
1. Let's install the bcrypt python module to create a hash of the password. Prometheus will not store your passwords; it will compute the hash and compare it with the existing one for the given user.
sudo apt-get -y install python3-bcrypt2. Now, create a simple script that will ask for input and return the hash for the password.
cat<<EOF | tee -a generate_password.py
import getpass
import bcrypt

password = getpass.getpass("password: ")
hashed_password = bcrypt.hashpw(password.encode("utf-8"), bcrypt.gensalt())
print(hashed_password.decode())
EOF
3. Run the script and enter Gladiators8204! for the password.
python3 generate_password.py4. Copy this hash and create an additional Prometheus configuration file.
cat <<EOF | tee -a /etc/prometheus/web.yml
basic_auth_users:
    admin: $2b$12$N1hlkqPGcg06FoJ/BCZbHeBQjvXrkeEZvlMRuxT.dopZIQPqehMA2
EOF
5. Now, we need to provide this config to the Prometheus. Let's update the systemd service definition.
sudo vim /etc/systemd/system/prometheus.service
---
ExecStart=/usr/local/bin/prometheus \
  ...
  --web.config.file=/etc/prometheus/web.yml
---
6. Restart Prometheus
sudo systemctl daemon-reload
sudo systemctl restart prometheus
sudo systemctl status prometheus
7. Now, we can test basic authentication. Go to Prometheus and reload the page.
Install Node Exporter
Next, we're going to set up and configured Node Exporter to collect Linux system metrics like CPU load and disk I/O. Node Exporter will expose these as Prometheus-style metrics. Since the installation process is very similar, I'm not going to cover as deep as Prometheus.
1. First, let's create a system user for Node Exporter by running the following command.
sudo useradd \
    --system \
    --no-create-home \
    --shell /bin/false node_exporter
2. Use wget command to download binary & Extract node exporter from the archive.
wget https://github.com/prometheus/node_exporter/releases/download/v1.4.0/node_exporter-1.4.0.linux-amd64.tar.gz

tar -xvf node_exporter-1.4.0.linux-amd64.tar.gz
3. Copy binary to the /usr/local/bin.
sudo cp node_exporter-1.4.0.linux-amd64/node_exporter /usr/local/bin/4. Create similar systemd unit file.
cat<<EOF | tee -a /etc/systemd/system/node_exporter.service
[Unit]
Description=Node Exporter
After=network.target

[Service]
User=node_exporter
Group=node_exporter
Type=simple
ExecStart=/usr/local/bin/node_exporter \
  --collector.disable-defaults \
  --collector.cpu \
  --collector.cpufreq \
  --collector.meminfo \
  --collector.loadavg \
  --collector.uname \
  --collector.stat \
  --collector.netclass \
  --collector.netdev \
  --collector.netstat \
  --collector.ethtool \
  --collector.filesystem \
  --collector.diskstats \
  --collector.systemd

[Install]
WantedBy=multi-user.target
EOF
5. Enable & Start Node Exporter
systemctl enable --now node_exporter.service
systemctl status node_exporter.service
Configure Prometheus
1. If you go to the targets section, you will see that the Prometheus target is down. Prometheus requires a username and password to scrape itself as well. So let's update the Prometheus target.
sudo vim /etc/prometheus/prometheus.yml
---
scrape_configs:
  - job_name: "prometheus"
    basic_auth:
      username: admin
      password: Gladiators2804!
    static_configs:
      - targets: ["<ip-prometheus-server>:9090"]
2. Restart Prometheus
systemctl restart prometheus.service3. Create a static target for node_exporter, you need to add job_name with static_configs.
sudo vim /etc/prometheus/prometheus.yml
---
  - job_name: node_export
    static_configs:
      - targets: ["<ip-node_exporter>:9100","<ip-node_exporter-2>:9100"]
---

systemctl restart prometheus.service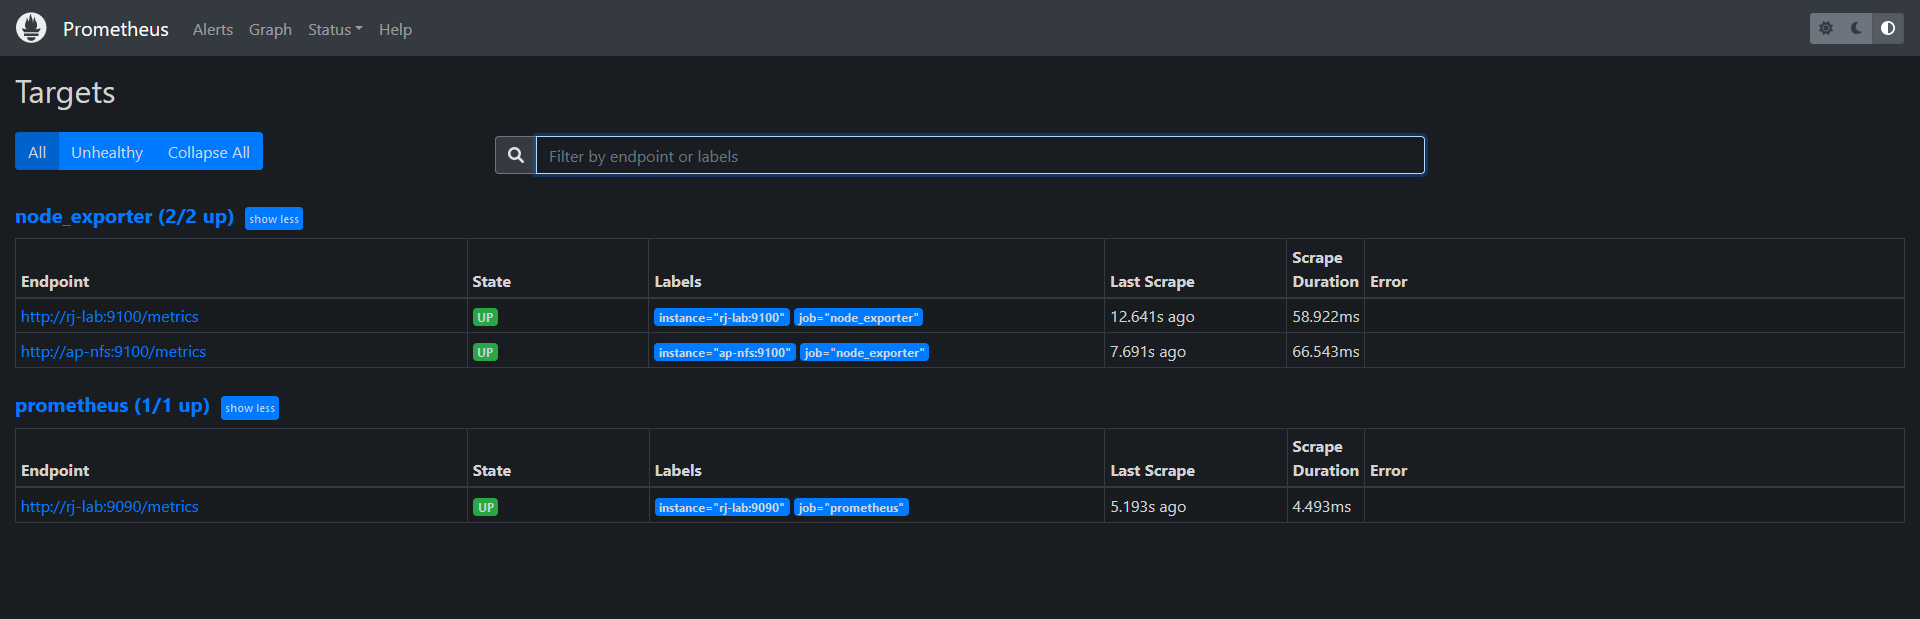
Install Grafana
To visualize metrics we can use Grafana. There are many different data sources that Grafana supports, one of them is Prometheus.
1. Download & Install Grafana. You can download Grafana here: Download Grafana | Grafana Labs
sudo apt-get install -y adduser libfontconfig1
wget https://dl.grafana.com/oss/release/grafana_8.5.26_amd64.deb
sudo dpkg -i grafana_8.5.26_amd64.deb
2. Enable & Start Grafana
sudo systemct daemon-reload
sudo systemctl enable --now grafana-server
sudo systemctl status grafana-server.service
- Go to
http://<ip>:3000and log in to the Grafana using default credentials. The username isadmin, and the password isadminas well. - When you log in for the first time, you get the option to change the password.
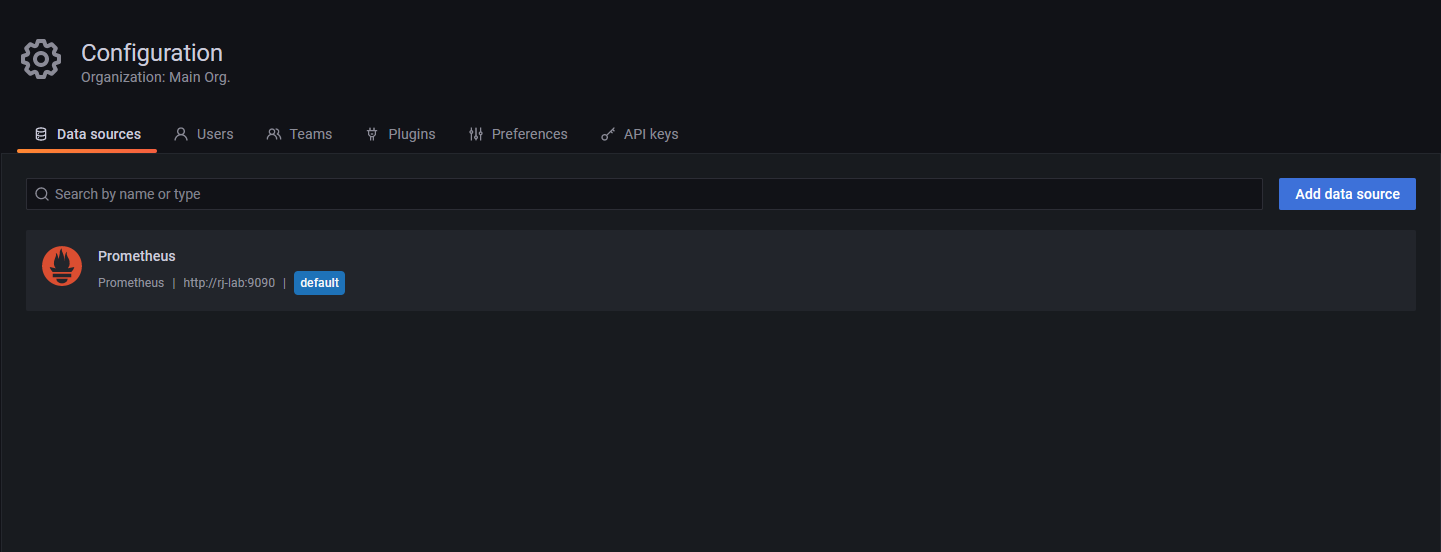
- To visualize metrics, you need to add a data source first. Click
Add data sourceand select Prometheus. For the URL, enterhttp://localhost:9090and clickSave and test. You can seeData source is working. - Usually, in production environments, you would store all the configurations in Git. Let me show you another way to add a data source as a code. Let's remove the data source from UI.
3. Create a new datasources.yaml file. We also need to update the Grafana datasource to provide a username and password.
cat<<EOF | tee -a /etc/grafana/provisioning/datasources/datasources.yaml
apiVersion: 1

datasources:
  - name: Prometheus
    type: prometheus
    url: http://<ip-prometheus-server>:9090
    isDefault: true
    basicAuth: true
    basicAuthUser: admin
    secureJsonData:
      basicAuthPassword: Gladiators8204!
EOF
4. Restart Grafana
sudo systemctl restart grafana-server
- Go back to Grafana and refresh the page. You should see the Prometheus data source.
Import Grafana Dashboard
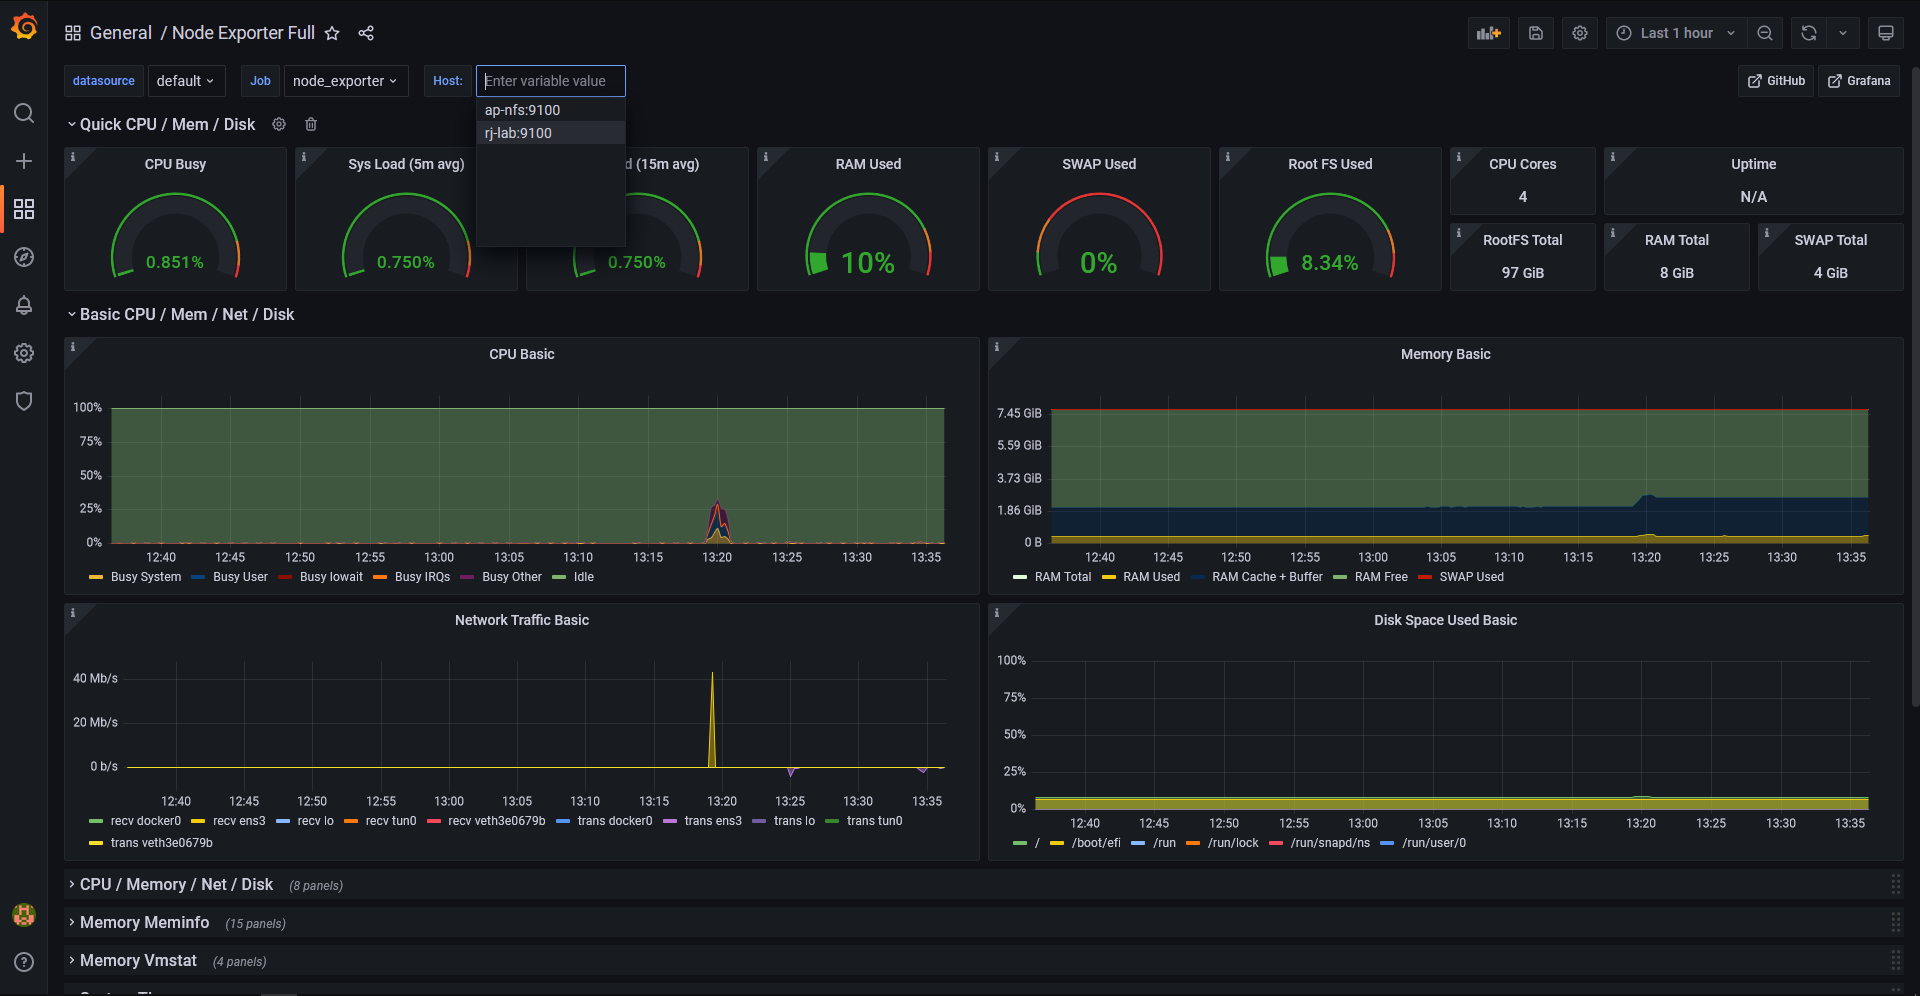
1. Since we already have Node Exporter, we can import an open-source dashboard to visualize CPU, Memory, Network, and a bunch of other metrics. You can search for node exporter on the Grafana website https://grafana.com/grafana/dashboards/.
2. Copy 1860 ID to Clipboard.
3. Now, in Grafana, you can click Import and paste this ID. Then load the dashboard. Select Prometheus datasource and click import.