Introduction
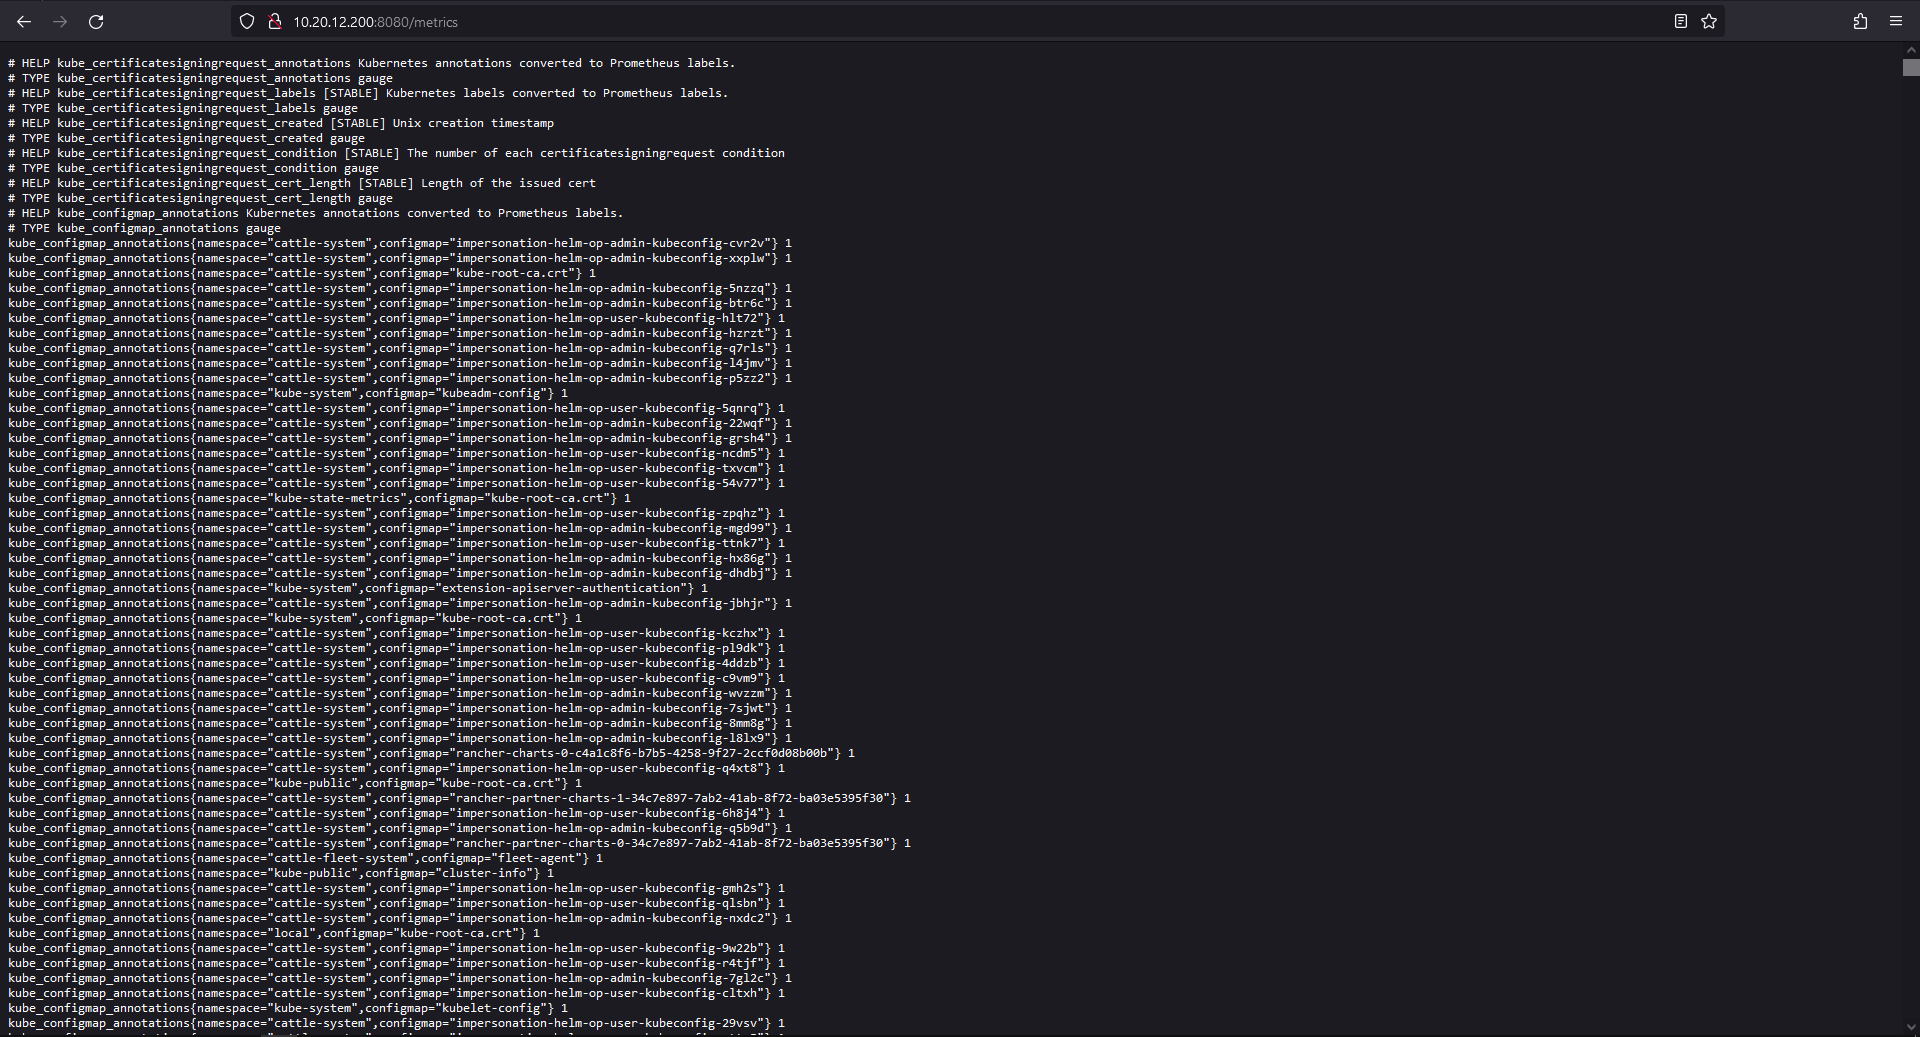
kube-state-metrics is an open-source project to generate metrics about the state of the Kubernetes Cluster Objects. It is a service that listens to the Kubernetes API server. It does not perform any modification on Kubernetes API just reads the required data for metrics. Such metrics include the pod status, node capacity, available deployment replicas, resources requests and limits, and many more.
It is important to not confuse the Kubernetes metrics server with kube-state-metrics. The Kubernetes metrics server provides information about the usage of the cluster resources (such as CPU and memory) which is useful for scaling, while kube-state-metrics focuses more on the health of the Kubernetes objects in your cluster, such as the availability of pods and the readiness of nodes.
Implementing kube-state-metrics
1. Add Helm Repositories
helm repo add prometheus-community https://prometheus-community.github.io/helm-charts

helm repo update
2. Install kube-state-metrics
helm install --create-namespace \
    -n kube-state-metrics \
    kube-state-metrics prometheus-community/kube-state-metrics
3. Install kube-state-metrics with custom configuration (optional)
You can override the default configurations of kube-state-metrics, such as the metrics it exposes, memory limit, and number of replicas. To view the available configurations, run the following command.
helm show values prometheus-community/kube-state-metrics > config.yamlEdit config.yaml with your custom configuration. When its done, install using your config.yaml configuration
helm install -f config.yaml \
    --create-namespace \
    -n kube-state-metrics \
    kube-state-metrics prometheus-community/kube-state-metrics
This installs kube-state-metrics with the configuration values that you specified in the config.yaml file.
4. kube-state-metrics has been successfully installed in your cluster. Now you have to expose it
kubectl edit service/kube-state-metrics -n kube-state-metrics
---
spec:
# type: ClusterIP
  type: NodePort
kubectl get svc -n kube-state-metrics
NAME                 TYPE       CLUSTER-IP      EXTERNAL-IP   PORT(S)          AGE
kube-state-metrics   NodePort   10.111.34.100   <none>        8080:32007/TCP   16m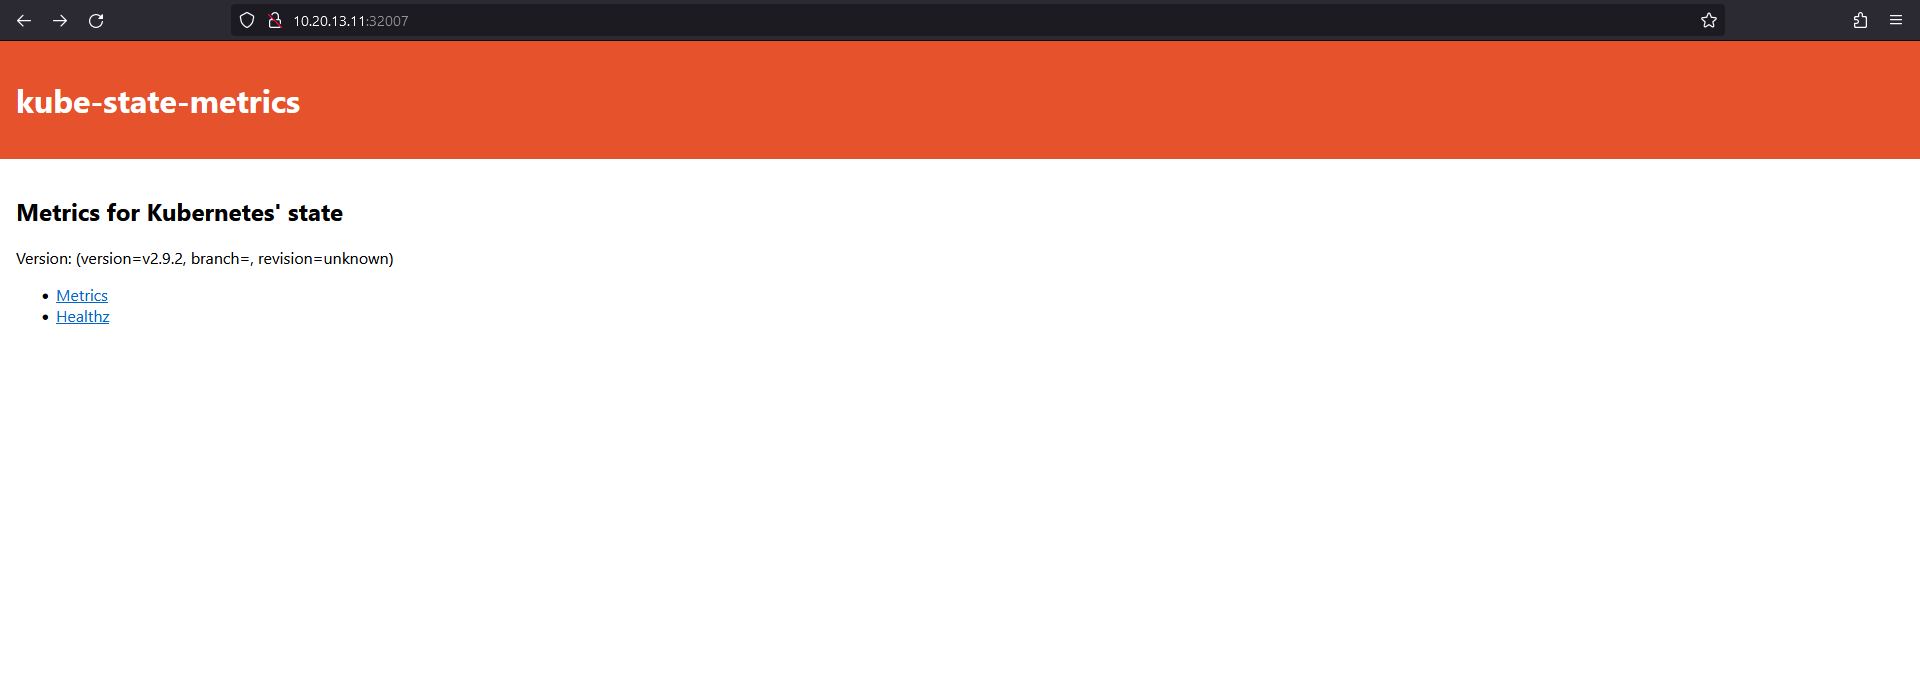
Configure Haproxy (Optional)
apt install haproxy
cat<<EOF >> /etc/haproxy/haproxy.cfg
# kube-state-metrics #
frontend kube-state-metrics
   bind *:8080
   default_backend kube-state-metrics

backend kube-state-metrics
    balance source
    server kube-state-metrics-1 10.20.13.11:32007 check
    server kube-state-metrics-2 10.20.13.12:32007 check
    server kube-state-metrics-3 10.20.13.13:32007 check
EOF

systemctl restart haproxy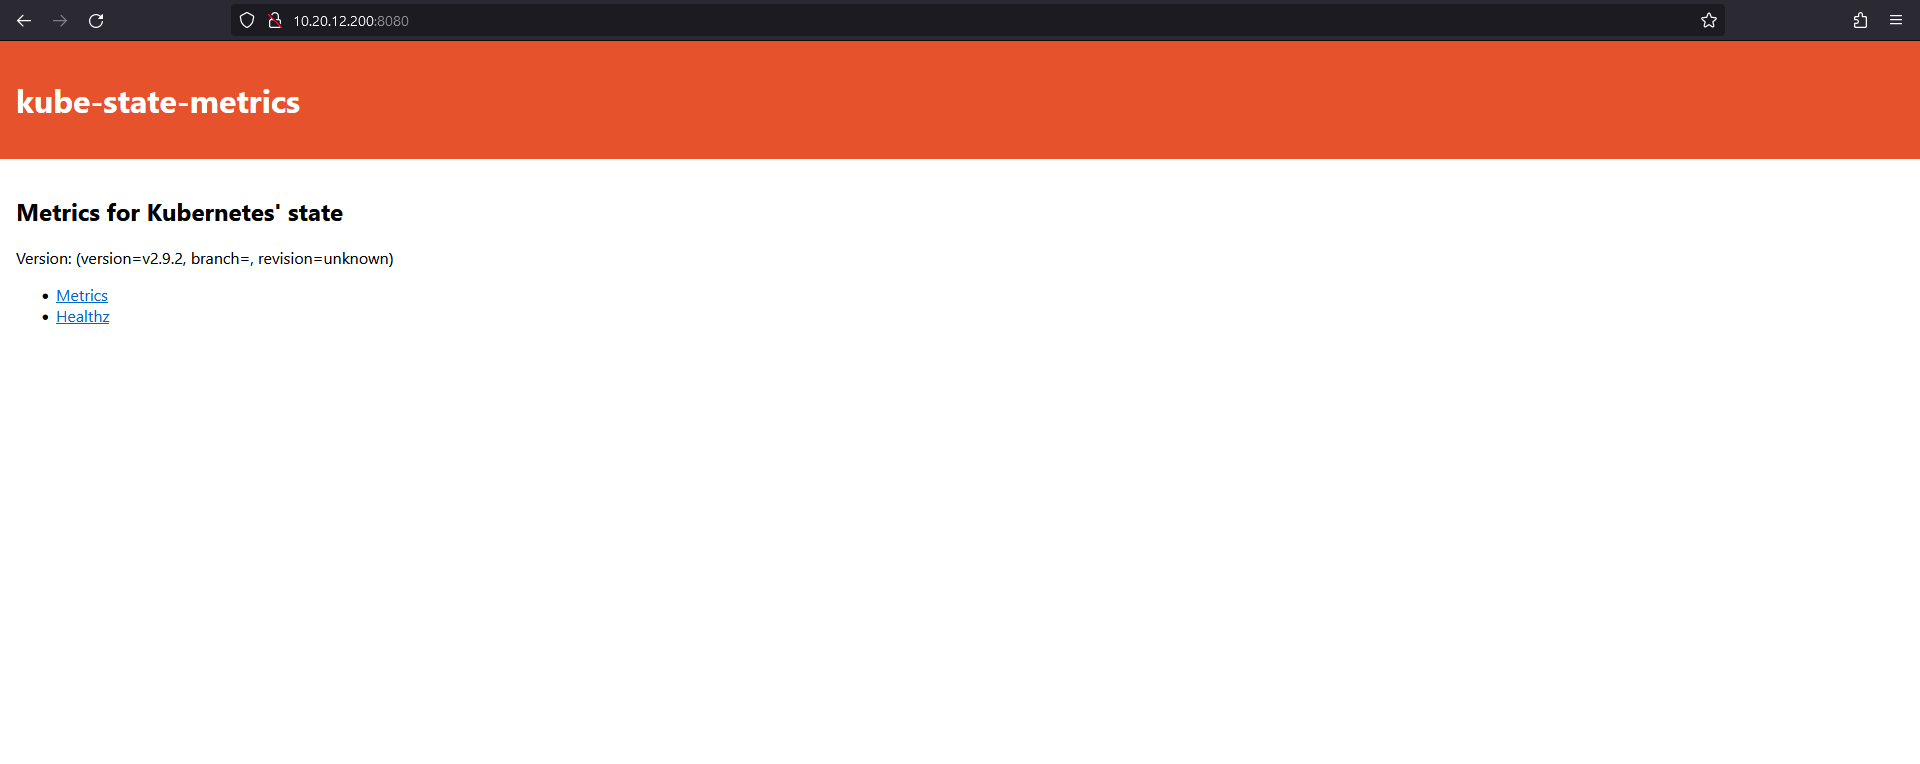
Reference
 kubernetes


